

324
V. R. NAIR and T. S. S. RAo:
c
0
1', 11420
0
C
01
I
\
0
0
I
0
- 5000
I
\
,
.......... R
01
Q)
I
\
g
,£
I
Q
0--0 F
I
Q)
Q)
I
\
,£
0
\
"0
,
\
]] 4000
,
\
.!;;
I
\
\
C')
::J
I
\
0
,
\
E
I
\
C')
I
\
700 8
\
0
E
I
\
\
I
\
I
~
0
,
\
I
ls;? 3000
I
I
I
Q)
I
I
a.
lI
,
Q)
I
en
a.
I
SOOC
,
Q)
en
I
E
I
~ 2000
,
'u
I
Q)
E
I
a.
Ti
,
en
I
Q)
I
300 -~
I
0
I
l'01000
,
Q)
I
.0
lI
E
Q)
~
I
.0
I
100 ~
, ,
E
, I
::J
, I
Z
0
0
26
27
28
29
30
31
32
37
38
39
40
41
42
43
WS
E S
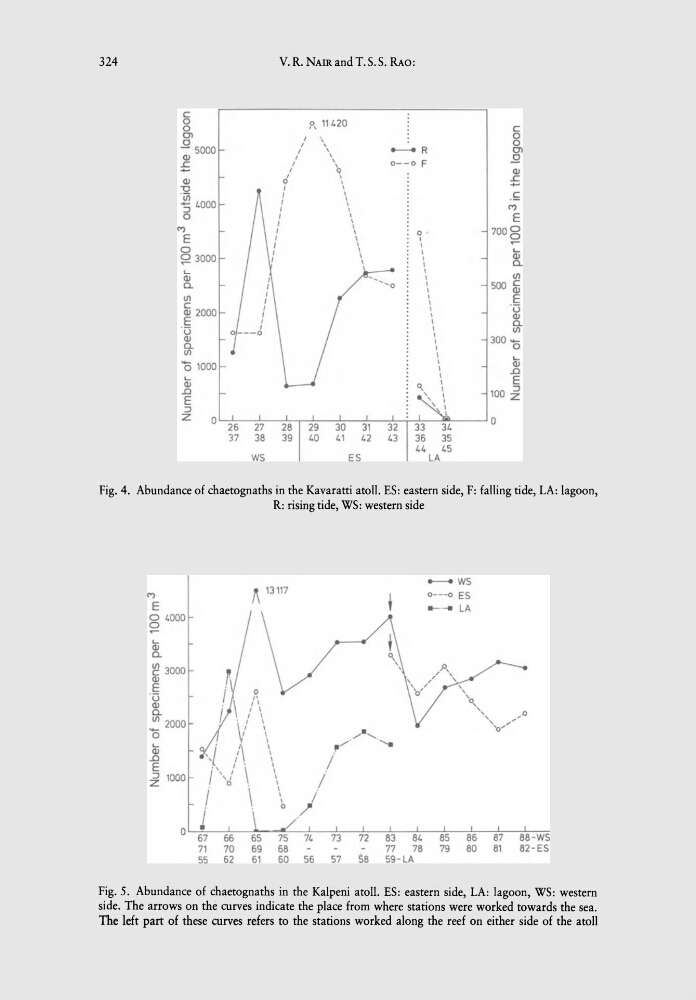
Fig. 4. Abundance of chaetognaths in the Kavaratti atoll. ES: eastern side, F: falling tide, LA: lagoon,
R: rising tide, WS: western side
C')
E
01.000
o
IQ)
a.
~ 3000
Q)
E
'u
Q)
a.
en 2000
'0
IQ)
.0
E
~ 1000
o 67
66
71
70
55
62
~ 13 117
I
I
\
\
\
\
\
I
\
\
\
\
I
\
I
b
.......... WS
0- - -0 ES
11- . .... LA
74
73
72
83
a4
85
a6
a7
88 -WS
77
78
79
80
81
82 - ES
56
57
S8
59 - LA
Fig.S. Abundance of chaetognaths in the Kalpeni atoll. ES: eastern side, LA: lagoon, WS: western
side. The arrows on the curves indicate the place from where stations were worked towards the sea.
The left part of these curves refers to the stations worked along the reef on either side of the atoll
V. R. NAIR and T. S. S. RAo:
c
0
1', 11420
0
C
01
I
\
0
0
I
0
- 5000
I
\
,
.......... R
01
Q)
I
\
g
,£
I
Q
0--0 F
I
Q)
Q)
I
\
,£
0
\
"0
,
\
]] 4000
,
\
.!;;
I
\
\
C')
::J
I
\
0
,
\
E
I
\
C')
I
\
700 8
\
0
E
I
\
\
I
\
I
~
0
,
\
I
ls;? 3000
I
I
I
Q)
I
I
a.
lI
,
Q)
I
en
a.
I
SOOC
,
Q)
en
I
E
I
~ 2000
,
'u
I
Q)
E
I
a.
Ti
,
en
I
Q)
I
300 -~
I
0
I
l'01000
,
Q)
I
.0
lI
E
Q)
~
I
.0
I
100 ~
, ,
E
, I
::J
, I
Z
0
0
26
27
28
29
30
31
32
37
38
39
40
41
42
43
WS
E S
Fig. 4. Abundance of chaetognaths in the Kavaratti atoll. ES: eastern side, F: falling tide, LA: lagoon,
R: rising tide, WS: western side
C')
E
01.000
o
IQ)
a.
~ 3000
Q)
E
'u
Q)
a.
en 2000
'0
IQ)
.0
E
~ 1000
o 67
66
71
70
55
62
~ 13 117
I
I
\
\
\
\
\
I
\
\
\
\
I
\
I
b
.......... WS
0- - -0 ES
11- . .... LA
74
73
72
83
a4
85
a6
a7
88 -WS
77
78
79
80
81
82 - ES
56
57
S8
59 - LA
Fig.S. Abundance of chaetognaths in the Kalpeni atoll. ES: eastern side, LA: lagoon, WS: western
side. The arrows on the curves indicate the place from where stations were worked towards the sea.
The left part of these curves refers to the stations worked along the reef on either side of the atoll