

14
D. H. JOHNSON:
JANUARY (1966-67)
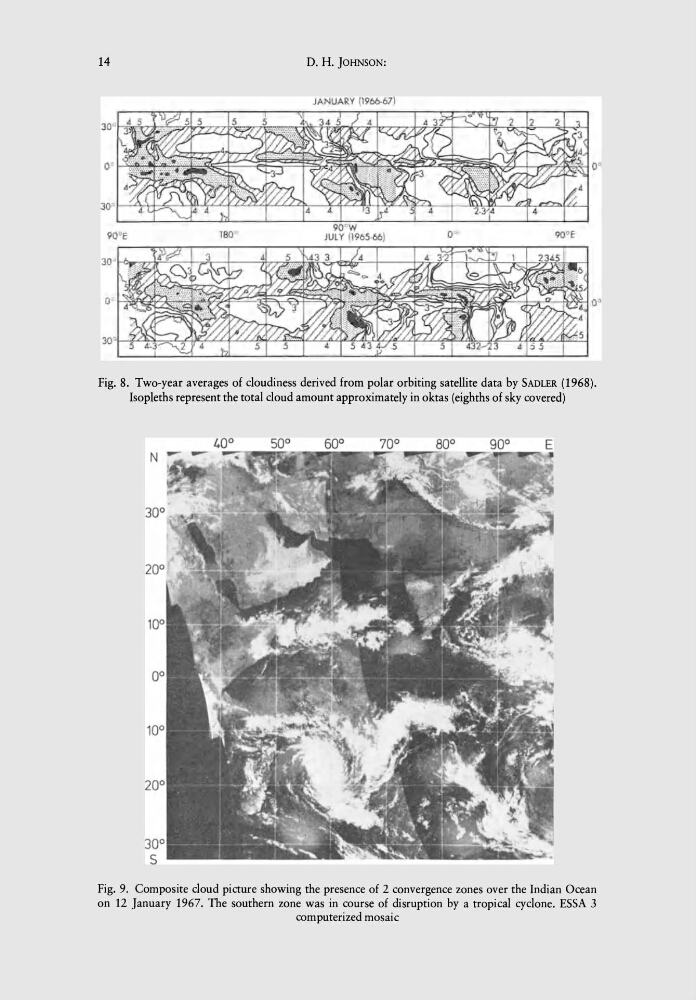
Fig. 8. Two-year averages of cloudiness derived from polar orbiting satellite data by SADLER (1968).
Isopleths represent the total cloud amount approximately in oktas (eighths of sky covered)
30°
30°
S
Fig. 9. Composite cloud picture showing the presence of 2 convergence zones over the Indian Ocean
on 12 January 1967. The southern zone was in course of disruption by a tropical cyclone. ESSA 3
computerized mosaic
D. H. JOHNSON:
JANUARY (1966-67)
Fig. 8. Two-year averages of cloudiness derived from polar orbiting satellite data by SADLER (1968).
Isopleths represent the total cloud amount approximately in oktas (eighths of sky covered)
30°
30°
S
Fig. 9. Composite cloud picture showing the presence of 2 convergence zones over the Indian Ocean
on 12 January 1967. The southern zone was in course of disruption by a tropical cyclone. ESSA 3
computerized mosaic