

3JOS
Agulhas Bank Plankton
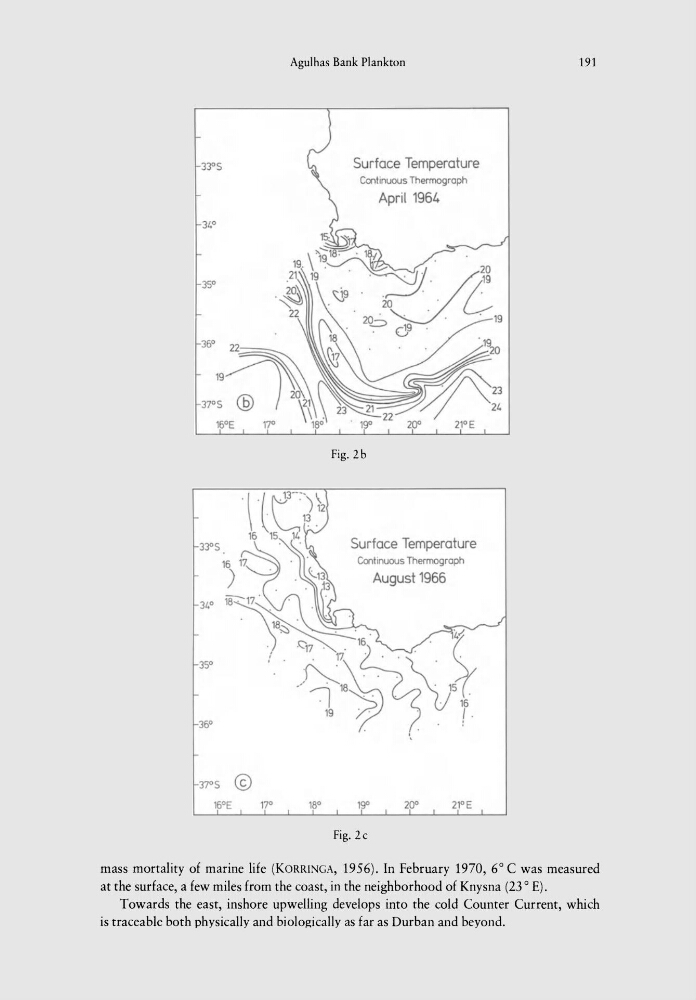
Surface Temperature
Continuous Thermograph
April 1964
Fig.2b
Surface Temperature
Continuous Thermograph
August 1966
'90
Fig.2c
191
mass mortality of marine life (KORRINGA, 1956). In February 1970, 6° C was measured
at the surface, a few miles from the coast, in the neighborhood of Knysna (23 ° E).
Towards the east, inshore upwelling develops into the cold Counter Current, which
is traceable both physically and biologically as far as Durban and beyond.
Agulhas Bank Plankton
Surface Temperature
Continuous Thermograph
April 1964
Fig.2b
Surface Temperature
Continuous Thermograph
August 1966
'90
Fig.2c
191
mass mortality of marine life (KORRINGA, 1956). In February 1970, 6° C was measured
at the surface, a few miles from the coast, in the neighborhood of Knysna (23 ° E).
Towards the east, inshore upwelling develops into the cold Counter Current, which
is traceable both physically and biologically as far as Durban and beyond.