

178
N. M. SHAH:
when it is around 33.0%o,and in November when it is only 31.80/00. The isohaline distribution in November, soon after the strong haloclines of the previous 6 months, indicates
that sinking of the low-salinity surface water has started. Below 5 m depth the water is
typically marine throughout the year, thus it may be concluded that the lower salinity
at the surface is due to the direct influence of the backwater run-off, which spreads into
a thin surface layer by the time it reaches the area under study.
Temperature (OC)
22
21.
26
28
30
32
5
E
£10
a.
w
0
15
,
20
2
3 5
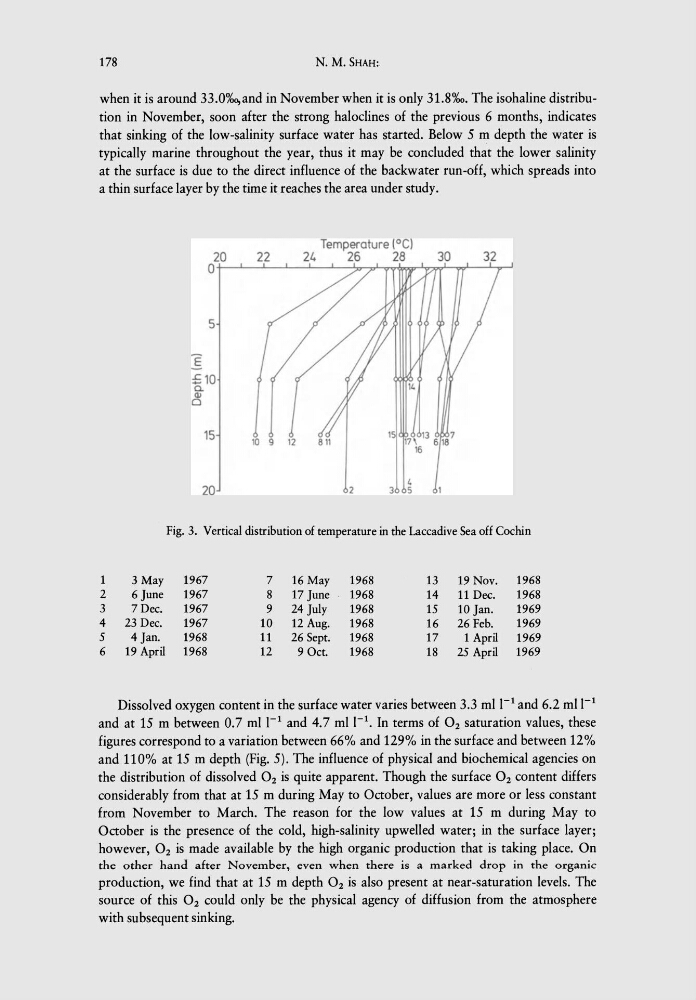
Fig. 3. Vertical distribution of temperature in the Laccadive Sea off Cochin
1
3 May
1967
7
16 May
1968
13
19 Nov.
1968
2
6 June
1967
8
17 June
1968
14
11 Dec.
1968
3
7 Dec.
1967
9
24 July
1968
15
10 Jan.
1969
4
23 Dec.
1967
10
12 Aug.
1968
16
26 Feb.
1969
5
4 Jan.
1968
11
26 Sept.
1968
17
1 April
1969
6
19 April
1968
12
9 Oct.
1968
18
25 April
1969
Dissolved oxygen content in the surface water varies between 3.3 mll- 1 and 6.2 mll- 1
and at 15 m between 0.7 mll- 1 and 4.7 mll- 1 • In terms of O2 saturation values, these
figures correspond to a variation between 66% and 129% in the surface and between 12%
and 110% at 15 m depth (Fig. 5). The influence of physical and biochemical agencies on
the distribution of dissolved O2 is quite apparent. Though the surface O2 content differs
considerably from that at 15 m during May to October, values are more or less constant
from November to March. The reason for the low values at 15 m during May to
October is the presence of the cold, high-salinity upwelled water; in the surface layer;
however, O2 is made available by the high organic production that is taking place. On
the other hand after November, even when there is a marked drop in the organic
production, we find that at 15 m depth O2 is also present at near-saturation levels. The
source of this O2 could only be the physical agency of diffusion from the atmosphere
with subsequent sinking.
N. M. SHAH:
when it is around 33.0%o,and in November when it is only 31.80/00. The isohaline distribution in November, soon after the strong haloclines of the previous 6 months, indicates
that sinking of the low-salinity surface water has started. Below 5 m depth the water is
typically marine throughout the year, thus it may be concluded that the lower salinity
at the surface is due to the direct influence of the backwater run-off, which spreads into
a thin surface layer by the time it reaches the area under study.
Temperature (OC)
22
21.
26
28
30
32
5
E
£10
a.
w
0
15
,
20
2
3 5
Fig. 3. Vertical distribution of temperature in the Laccadive Sea off Cochin
1
3 May
1967
7
16 May
1968
13
19 Nov.
1968
2
6 June
1967
8
17 June
1968
14
11 Dec.
1968
3
7 Dec.
1967
9
24 July
1968
15
10 Jan.
1969
4
23 Dec.
1967
10
12 Aug.
1968
16
26 Feb.
1969
5
4 Jan.
1968
11
26 Sept.
1968
17
1 April
1969
6
19 April
1968
12
9 Oct.
1968
18
25 April
1969
Dissolved oxygen content in the surface water varies between 3.3 mll- 1 and 6.2 mll- 1
and at 15 m between 0.7 mll- 1 and 4.7 mll- 1 • In terms of O2 saturation values, these
figures correspond to a variation between 66% and 129% in the surface and between 12%
and 110% at 15 m depth (Fig. 5). The influence of physical and biochemical agencies on
the distribution of dissolved O2 is quite apparent. Though the surface O2 content differs
considerably from that at 15 m during May to October, values are more or less constant
from November to March. The reason for the low values at 15 m during May to
October is the presence of the cold, high-salinity upwelled water; in the surface layer;
however, O2 is made available by the high organic production that is taking place. On
the other hand after November, even when there is a marked drop in the organic
production, we find that at 15 m depth O2 is also present at near-saturation levels. The
source of this O2 could only be the physical agency of diffusion from the atmosphere
with subsequent sinking.