

Seasonal Variation of Phytoplankton Pigments in the Laccadive Sea off Cochin
177
TIME
1 2 1 ~
DEPTH om 15m
TEMP. :10-2 2:1 -1
·C
SAL _ 2~9 ~5~
%.
FLOODING
8
°1- SAT.
%
120 2S
CHL - ~s
m9/m
6 -8 4 -1
LOW TIDE
LOW TIDE ~LOODING
fz\
V
l U I
I U,
TIME
09:10
TI ME
0900
1100
1415
DEPTH om Ism
DEPTH om Ism om Ism om Ism
TEMP_ 28 -7 2:1 -1
·C
TEMP.
29-4 23-2 29 -6 23-1 - -
·C
SAL _ ~7"7S ~4-9E
%.
SAL. ~4-S4 3S-0S 25-25 34-97 ~7-:IO ~-99
%.
O. - SAT_
%
131
35
O.SAT.
%
126 18-5 129 23 - -
CH~i;S 6 -0 -
m'lm
C~q/r!·
6 -0 3-0 8 -5 3-9 7-5 3 -8
m m
,
TIME
lOIS
OEPTH Om Ism
TEMP. 28-9 23 -2
·C
SAL_ :10-21 34-97
%.
°iSAT.
%
137 29
CHL _!,
mq/m
8-8 3-8
TIME
1145
OEPTH Om 14m
TEMP. 30-0 23-5
·C
SAL _ 19-05 304'97
%.
°iSAT_
%
91
12-5
CH~i:' m9 m
S-9 6-0
~-OfFFROM
~KWATEA
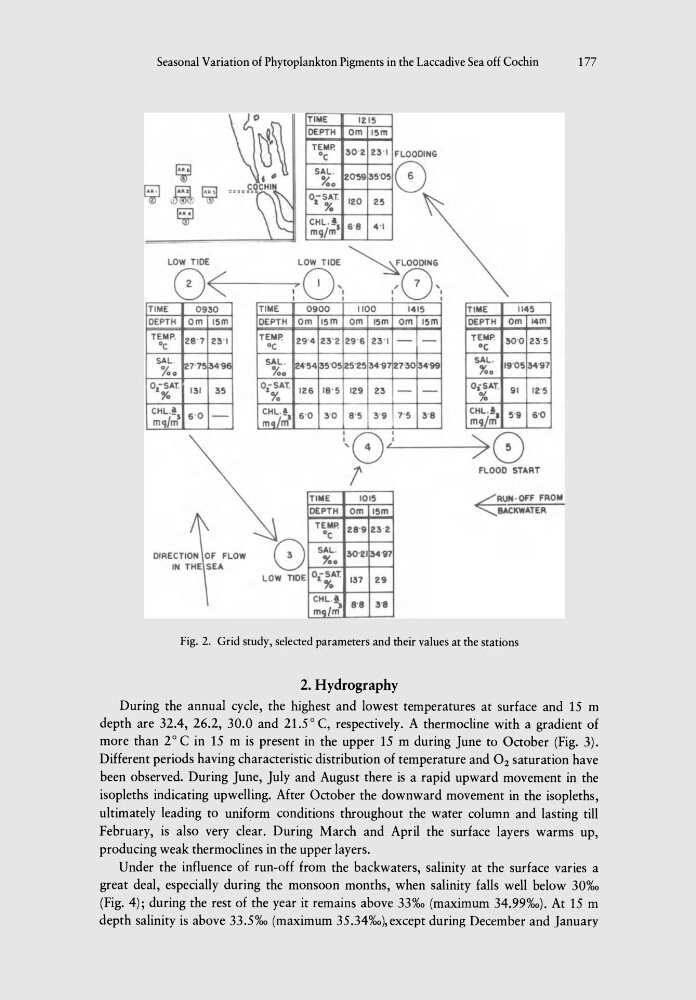
Fig_ 2_ Grid study, selected parameters and their values at the stations
2. Hydrography
During the annual cycle, the highest and lowest temperatures at surface and 15 m
depth are 32.4, 26.2, 30.0 and 21.5
0
C, respectively. A thermocline with a gradient of
more than 2
0
C in 15 m is present in the upper 15 m during June to October (Fig. 3).
Different periods having characteristic distribution of temperature and O2 saturation have
been observed. During June, July and August there is a rapid upward movement in the
isopleths indicating upwelling. After October the downward movement in the isopleths,
ultimately leading to uniform conditions throughout the water column and lasting till
February, is also very clear. During March and April the surface layers warms up,
producing weak thermoclines in the upper layers.
Under the influence of run-off from the backwaters, salinity at the surface varies a
great deal, especially during the monsoon months, when salinity falls well below 30%0
(Fig. 4); during the rest of the year it remains above 330/00 (maximum 34.99%0). At 15 m
depth salinity is above 33.5%0 (maximum 35.34%0), except during December and January
177
TIME
1 2 1 ~
DEPTH om 15m
TEMP. :10-2 2:1 -1
·C
SAL _ 2~9 ~5~
%.
FLOODING
8
°1- SAT.
%
120 2S
CHL - ~s
m9/m
6 -8 4 -1
LOW TIDE
LOW TIDE ~LOODING
fz\
V
l U I
I U,
TIME
09:10
TI ME
0900
1100
1415
DEPTH om Ism
DEPTH om Ism om Ism om Ism
TEMP_ 28 -7 2:1 -1
·C
TEMP.
29-4 23-2 29 -6 23-1 - -
·C
SAL _ ~7"7S ~4-9E
%.
SAL. ~4-S4 3S-0S 25-25 34-97 ~7-:IO ~-99
%.
O. - SAT_
%
131
35
O.SAT.
%
126 18-5 129 23 - -
CH~i;S 6 -0 -
m'lm
C~q/r!·
6 -0 3-0 8 -5 3-9 7-5 3 -8
m m
,
TIME
lOIS
OEPTH Om Ism
TEMP. 28-9 23 -2
·C
SAL_ :10-21 34-97
%.
°iSAT.
%
137 29
CHL _!,
mq/m
8-8 3-8
TIME
1145
OEPTH Om 14m
TEMP. 30-0 23-5
·C
SAL _ 19-05 304'97
%.
°iSAT_
%
91
12-5
CH~i:' m9 m
S-9 6-0
~-OfFFROM
~KWATEA
Fig_ 2_ Grid study, selected parameters and their values at the stations
2. Hydrography
During the annual cycle, the highest and lowest temperatures at surface and 15 m
depth are 32.4, 26.2, 30.0 and 21.5
0
C, respectively. A thermocline with a gradient of
more than 2
0
C in 15 m is present in the upper 15 m during June to October (Fig. 3).
Different periods having characteristic distribution of temperature and O2 saturation have
been observed. During June, July and August there is a rapid upward movement in the
isopleths indicating upwelling. After October the downward movement in the isopleths,
ultimately leading to uniform conditions throughout the water column and lasting till
February, is also very clear. During March and April the surface layers warms up,
producing weak thermoclines in the upper layers.
Under the influence of run-off from the backwaters, salinity at the surface varies a
great deal, especially during the monsoon months, when salinity falls well below 30%0
(Fig. 4); during the rest of the year it remains above 330/00 (maximum 34.99%0). At 15 m
depth salinity is above 33.5%0 (maximum 35.34%0), except during December and January