

Phytoplankton Production in the Southeastern Indian Ocean
137
3. Distribution of Primary Production
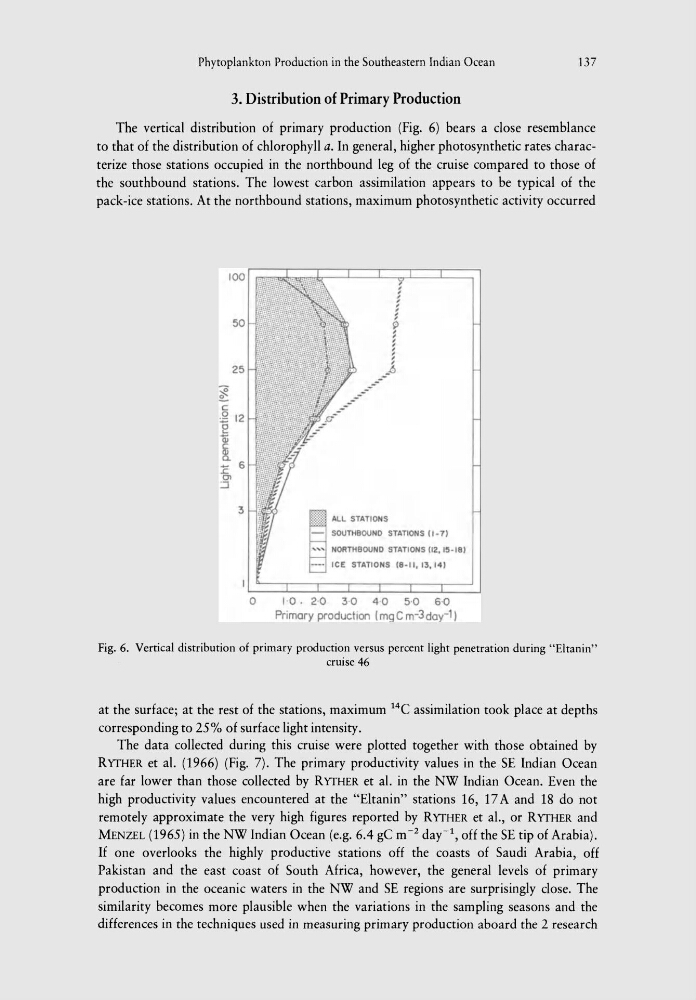
The vertical distribution of primary production (Fig. 6) bears a close resemblance
to that of the distribution of chlorophyll a. In general, higher photosynthetic rates characterize those stations occupied in the northbound leg of the cruise compared to those of
the southbound stations. The lowest carbon assimilation appears to be typical of the
pack-ice stations. At the northbound stations, maximum photosynthetic activity occurred
50
25
3
~
}< ALL STATIONS
-
SOUTHBOUND STATIONS (1-7)
'" NORTHBOUND STATIONS 112.15-18)
---- ICE STATIONS (8-11.13.14)
1-0. 2-0
3 ,0
4 '0
5 -0 6'0
Primary production I mg C m-3doy-l)
Fig. 6. Vertical distribution of primary production versus percent light penetration during "Eltanin"
cruise 46
at the surface; at the rest of the stations, maximum 14C assimilation took place at depths
corresponding to 25% of surface light intensity.
The data collected during this cruise were plotted together with those obtained by
RYfHER et al. (1966) (Fig. 7). The primary productivity values in the SE Indian Ocean
are far lower than those collected by RYTHER et at. in the NW Indian Ocean. Even the
high productivity values encountered at the "Eltanin" stations 16, 17 A and 18 do not
remotely approximate the very high figures reported by RYTHER et al., or RYTHER and
MENZEL (1965) in the NW Indian Ocean (e.g. 6.4 gC m- 2 day-\ off the SE tip of Arabia).
If one overlooks the highly productive stations off the coasts of Saudi Arabia, off
Pakistan and the east coast of South Africa, however, the general levels of primary
production in the oceanic waters in the NW and SE regions are surprisingly close. The
similarity becomes more plausible when the variations in the sampling seasons and the
differences in the techniques used in measuring primary production aboard the 2 research
137
3. Distribution of Primary Production
The vertical distribution of primary production (Fig. 6) bears a close resemblance
to that of the distribution of chlorophyll a. In general, higher photosynthetic rates characterize those stations occupied in the northbound leg of the cruise compared to those of
the southbound stations. The lowest carbon assimilation appears to be typical of the
pack-ice stations. At the northbound stations, maximum photosynthetic activity occurred
50
25
3
~
}< ALL STATIONS
-
SOUTHBOUND STATIONS (1-7)
'" NORTHBOUND STATIONS 112.15-18)
---- ICE STATIONS (8-11.13.14)
1-0. 2-0
3 ,0
4 '0
5 -0 6'0
Primary production I mg C m-3doy-l)
Fig. 6. Vertical distribution of primary production versus percent light penetration during "Eltanin"
cruise 46
at the surface; at the rest of the stations, maximum 14C assimilation took place at depths
corresponding to 25% of surface light intensity.
The data collected during this cruise were plotted together with those obtained by
RYfHER et al. (1966) (Fig. 7). The primary productivity values in the SE Indian Ocean
are far lower than those collected by RYTHER et at. in the NW Indian Ocean. Even the
high productivity values encountered at the "Eltanin" stations 16, 17 A and 18 do not
remotely approximate the very high figures reported by RYTHER et al., or RYTHER and
MENZEL (1965) in the NW Indian Ocean (e.g. 6.4 gC m- 2 day-\ off the SE tip of Arabia).
If one overlooks the highly productive stations off the coasts of Saudi Arabia, off
Pakistan and the east coast of South Africa, however, the general levels of primary
production in the oceanic waters in the NW and SE regions are surprisingly close. The
similarity becomes more plausible when the variations in the sampling seasons and the
differences in the techniques used in measuring primary production aboard the 2 research