

Primary Production in the Indian Ocean I
119
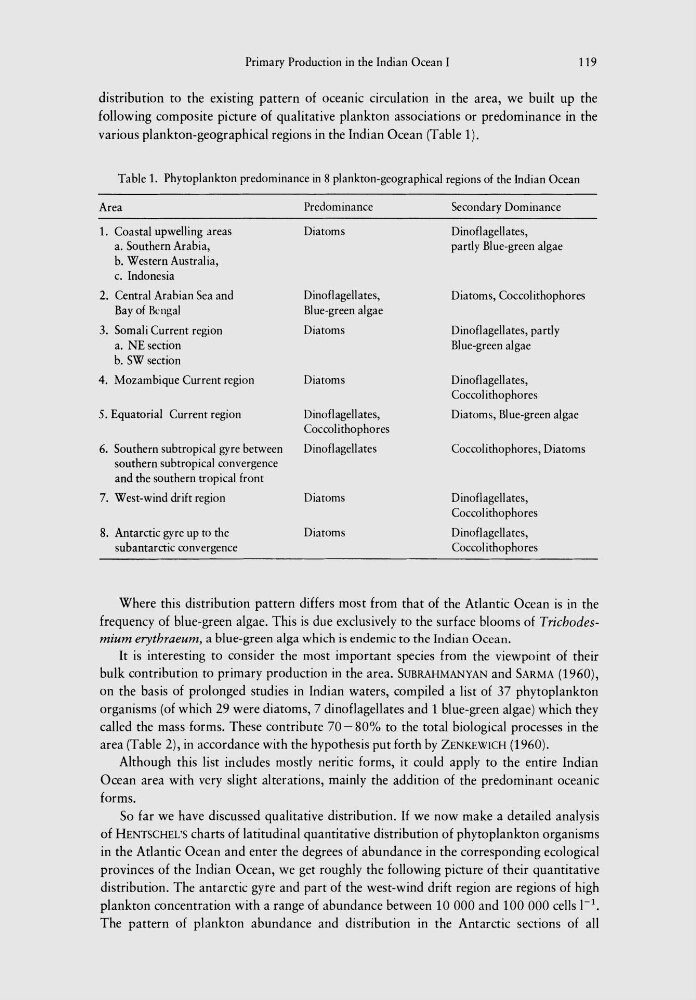
distribution to the existing pattern of oceanic circulation in the area, we built up the
following composite picture of qualitative plankton associations or predominance in the
various plankton-geographical regions in the Indian Ocean (Table 1).
Table 1. Phytoplankton predominance in 8 plankton-geographical regions of the Indian Ocean
Area
1. Coastal upwelling areas
a. Southern Arabia,
b. Western Australia,
c. Indonesia
2. Central Arabian Sea and
Bay of Bengal
3. Somali Current region
a. NE section
b. SW section
4. Mozambique Current region
5. Equatorial Current region
6. Southern subtropical gyre between
southern subtropical convergence
and the southern tropical front
7. West-wind drift region
8. Antarctic gyre up to the
subantarctic convergence
Predominance
Diatoms
Dinoflagellates,
BI ue-green algae
Diatoms
Diatoms
Dinoflagellates,
Coccolithophores
Dinoflagellates
Diatoms
Diatoms
Secondary Dominance
Dinoflagellates,
partly Blue-green algae
Diatoms, Coccolithophores
Dinoflagellates, partly
Bl ue-green algae
Dinoflagellates,
Coccolithophores
Diatoms, Blue-green algae
Coccolithophores, Diatoms
Dinoflagellates,
Coccolithophores
Dinoflagellates,
Coccolithophores
Where this distribution pattern differs most from that of the Atlantic Ocean is in the
frequency of blue-green algae. This is due exclusively to the surface blooms of Trichodesmium erythraeum, a blue-green alga which is endemic to the Indian Ocean.
lt is interesting to consider the most important species from the viewpoint of their
bulk contribution to primary production in the area. SUBRAHMANYAN and SARMA (1960),
on the basis of prolonged studies in Indian waters, compiled a list of 37 phytoplankton
organisms (of which 29 were diatoms, 7 dinoflagellates and 1 blue-green algae) which they
called the mass forms. These contribute 70 - 80% to the total biological processes in the
area (Table 2), in accordance with the hypothesis put forth by ZENKEWICH (1960).
Although this list includes mostly neritic forms, it could apply to the entire Indian
Ocean area with very slight alterations, mainly the addition of the predominant oceanic
forms.
So far we have discussed qualitative distribution. If we now make a detailed analysis
of HENTSCHEL'S charts of latitudinal quantitative distribution of phytoplankton organisms
in the Atlantic Ocean and enter the degrees of abundance in the corresponding ecological
provinces of the Indian Ocean, we get roughly the following picture of their quantitative
distribution. The antarctic gyre and part of the west-wind drift region are regions of high
plankton concentration with a range of abundance between 10 000 and 100 000 cells 1-1.
The pattern of plankton abundance and distribution in the Antarctic sections of all
119
distribution to the existing pattern of oceanic circulation in the area, we built up the
following composite picture of qualitative plankton associations or predominance in the
various plankton-geographical regions in the Indian Ocean (Table 1).
Table 1. Phytoplankton predominance in 8 plankton-geographical regions of the Indian Ocean
Area
1. Coastal upwelling areas
a. Southern Arabia,
b. Western Australia,
c. Indonesia
2. Central Arabian Sea and
Bay of Bengal
3. Somali Current region
a. NE section
b. SW section
4. Mozambique Current region
5. Equatorial Current region
6. Southern subtropical gyre between
southern subtropical convergence
and the southern tropical front
7. West-wind drift region
8. Antarctic gyre up to the
subantarctic convergence
Predominance
Diatoms
Dinoflagellates,
BI ue-green algae
Diatoms
Diatoms
Dinoflagellates,
Coccolithophores
Dinoflagellates
Diatoms
Diatoms
Secondary Dominance
Dinoflagellates,
partly Blue-green algae
Diatoms, Coccolithophores
Dinoflagellates, partly
Bl ue-green algae
Dinoflagellates,
Coccolithophores
Diatoms, Blue-green algae
Coccolithophores, Diatoms
Dinoflagellates,
Coccolithophores
Dinoflagellates,
Coccolithophores
Where this distribution pattern differs most from that of the Atlantic Ocean is in the
frequency of blue-green algae. This is due exclusively to the surface blooms of Trichodesmium erythraeum, a blue-green alga which is endemic to the Indian Ocean.
lt is interesting to consider the most important species from the viewpoint of their
bulk contribution to primary production in the area. SUBRAHMANYAN and SARMA (1960),
on the basis of prolonged studies in Indian waters, compiled a list of 37 phytoplankton
organisms (of which 29 were diatoms, 7 dinoflagellates and 1 blue-green algae) which they
called the mass forms. These contribute 70 - 80% to the total biological processes in the
area (Table 2), in accordance with the hypothesis put forth by ZENKEWICH (1960).
Although this list includes mostly neritic forms, it could apply to the entire Indian
Ocean area with very slight alterations, mainly the addition of the predominant oceanic
forms.
So far we have discussed qualitative distribution. If we now make a detailed analysis
of HENTSCHEL'S charts of latitudinal quantitative distribution of phytoplankton organisms
in the Atlantic Ocean and enter the degrees of abundance in the corresponding ecological
provinces of the Indian Ocean, we get roughly the following picture of their quantitative
distribution. The antarctic gyre and part of the west-wind drift region are regions of high
plankton concentration with a range of abundance between 10 000 and 100 000 cells 1-1.
The pattern of plankton abundance and distribution in the Antarctic sections of all