

Light and Nutrients in the Indian Ocean
SOUTHWEST MONSOON
10·
I
WESTERN PERIMETER
MOZAMBIQUE CHANNEL
0I
0-999m
"' "----------1000-1999m
CHAGOS SHOALS
CENTRAL BASIN
+
~
--------------~-~~f.--2000-2999m
~.
~L\.
~+3000-3999m ~ 0 '0' 0
~_
_...±::~~~o'>.'"'+-o .--/:~_
+
> L.OOOm
+
total below 1000m
~
++
I
I
I
I
1
0.25
0.20
0.15
0.10
0.05
0.00
1
0 .10
0.05
0.00
t 0.10
1 0 . 05
0.00
}
0.10
0.05
0,00
t 0.10
1 0 . 05
0.00
1
0.10
0.05
0.00
93
areas from the Malabar coast to about 10° S were covered in April and early May. Remaining areas were sampled in June. Included in these observations is a series of stations
taken east of the Carlsberg Ridge at 32 ° S in the eastern Indian Ocean in July.
aa) Total Organic Phosphorus
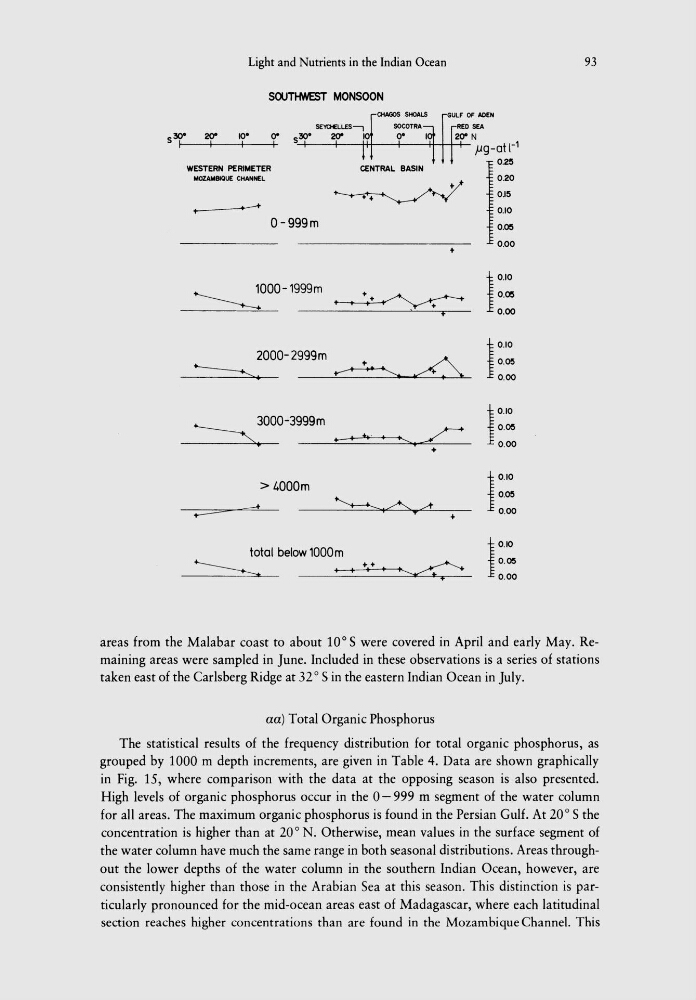
The statistical results of the frequency distribution for total organic phosphorus, as
grouped by 1000 m depth increments, are given in Table 4. Data are shown graphically
in Fig. 15, where comparison with the data at the opposing season is also presented.
High levels of organic phosphorus occur in the 0- 999 m segment of the water column
for all areas. The maximum organic phosphorus is found in the Persian Gulf. At 20° S the
concentration is higher than at 20° N. Otherwise, mean values in the surface segment of
the water column have much the same range in both seasonal distributions. Areas throughout the lower depths of the water column in the southern Indian Ocean, however, are
consistently higher than those in the Arabian Sea at this season. This distinction is particularly pronounced for the mid-ocean areas east of Madagascar, where each latitudinal
section reaches higher concentrations than are found in the Mozambique Channel. This
SOUTHWEST MONSOON
10·
I
WESTERN PERIMETER
MOZAMBIQUE CHANNEL
0I
0-999m
"' "----------1000-1999m
CHAGOS SHOALS
CENTRAL BASIN
+
~
--------------~-~~f.--2000-2999m
~.
~L\.
~+3000-3999m ~ 0 '0' 0
~_
_...±::~~~o'>.'"'+-o .--/:~_
+
> L.OOOm
+
total below 1000m
~
++
I
I
I
I
1
0.25
0.20
0.15
0.10
0.05
0.00
1
0 .10
0.05
0.00
t 0.10
1 0 . 05
0.00
}
0.10
0.05
0,00
t 0.10
1 0 . 05
0.00
1
0.10
0.05
0.00
93
areas from the Malabar coast to about 10° S were covered in April and early May. Remaining areas were sampled in June. Included in these observations is a series of stations
taken east of the Carlsberg Ridge at 32 ° S in the eastern Indian Ocean in July.
aa) Total Organic Phosphorus
The statistical results of the frequency distribution for total organic phosphorus, as
grouped by 1000 m depth increments, are given in Table 4. Data are shown graphically
in Fig. 15, where comparison with the data at the opposing season is also presented.
High levels of organic phosphorus occur in the 0- 999 m segment of the water column
for all areas. The maximum organic phosphorus is found in the Persian Gulf. At 20° S the
concentration is higher than at 20° N. Otherwise, mean values in the surface segment of
the water column have much the same range in both seasonal distributions. Areas throughout the lower depths of the water column in the southern Indian Ocean, however, are
consistently higher than those in the Arabian Sea at this season. This distinction is particularly pronounced for the mid-ocean areas east of Madagascar, where each latitudinal
section reaches higher concentrations than are found in the Mozambique Channel. This