

92
D. A. MCGILL:
NORTHEAST MONSOON
,ug - at , 1 S_3O"-+1_--I2f"_--II?"f------lr S'--3O"+---t---tt----+-+-tI---tt-I1---t'
0.25
0.20
0.15
0.10
0.05
0.00
O.lO{
0.05
0.00
O.l°r
0.05!
0.00
O.l°r
O· 05 i
0.00
O.l°t
0.05
0.00
0.1
1
0.05
0.0
WESTERN PERIMETER
MOZAMBtaUE CHANNEL
0-999m
1000-1999m
~
2000-2999m
3000-3999m
>L.OOOm
+
CENTRAL BASIN
*
~
'
+
+
+
EAST Of CARLSBERG RIDGE
+ I ~
total below 1000 m .
""-.
+
~~ .. ~c
+ 'P'
+
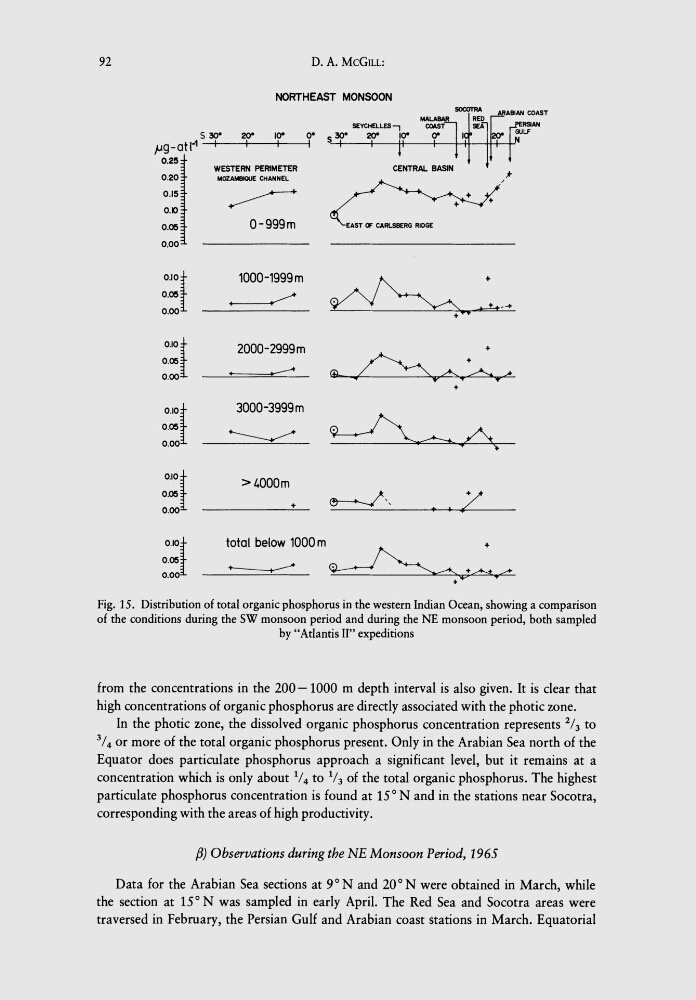
Fig. 15. Distribution of total organic phosphorus in the western Indian Ocean, showing a comparison
of the conditions during the SW monsoon period and during the NE monsoon period, both sampled
by "Atlantis II" expeditions
from the concentrations in the 200 - 1000 m depth interval is also given. It is clear that
high concentrations of organic phosphorus are directly associated with the photic zone.
In the photic zone, the dissolved organic phosphorus concentration represents 2/3 to
3 14 or more of the total organic phosphorus present. Only in the Arabian Sea north of the
Equator does particulate phosphorus approach a significant level, but it remains at a
concentration which is only about 1/4 to 1/3 of the total organic phosphorus. The highest
particulate phosphorus concentration is found at 15 ° N and in the stations near Socotra,
corresponding with the areas of high productivity.
f3) Observations during the NE Monsoon Period, 1965
Data for the Arabian Sea sections at 9° Nand 20° N were obtained in March, while
the section at 15° N was sampled in early April. The Red Sea and Socotra areas were
traversed in February, the Persian Gulf and Arabian coast stations in March. Equatorial
D. A. MCGILL:
NORTHEAST MONSOON
,ug - at , 1 S_3O"-+1_--I2f"_--II?"f------lr S'--3O"+---t---tt----+-+-tI---tt-I1---t'
0.25
0.20
0.15
0.10
0.05
0.00
O.lO{
0.05
0.00
O.l°r
0.05!
0.00
O.l°r
O· 05 i
0.00
O.l°t
0.05
0.00
0.1
1
0.05
0.0
WESTERN PERIMETER
MOZAMBtaUE CHANNEL
0-999m
1000-1999m
~
2000-2999m
3000-3999m
>L.OOOm
+
CENTRAL BASIN
*
~
'
+
+
+
EAST Of CARLSBERG RIDGE
+ I ~
total below 1000 m .
""-.
+
~~ .. ~c
+ 'P'
+
Fig. 15. Distribution of total organic phosphorus in the western Indian Ocean, showing a comparison
of the conditions during the SW monsoon period and during the NE monsoon period, both sampled
by "Atlantis II" expeditions
from the concentrations in the 200 - 1000 m depth interval is also given. It is clear that
high concentrations of organic phosphorus are directly associated with the photic zone.
In the photic zone, the dissolved organic phosphorus concentration represents 2/3 to
3 14 or more of the total organic phosphorus present. Only in the Arabian Sea north of the
Equator does particulate phosphorus approach a significant level, but it remains at a
concentration which is only about 1/4 to 1/3 of the total organic phosphorus. The highest
particulate phosphorus concentration is found at 15 ° N and in the stations near Socotra,
corresponding with the areas of high productivity.
f3) Observations during the NE Monsoon Period, 1965
Data for the Arabian Sea sections at 9° Nand 20° N were obtained in March, while
the section at 15° N was sampled in early April. The Red Sea and Socotra areas were
traversed in February, the Persian Gulf and Arabian coast stations in March. Equatorial