

developed over time, especially for animal ferritins and bacterial ferritins (Theil
et al. 2008; Chiancone and Ceci 2010; Le Brun et al. 2010). The multiple steps in
ferritin biomineralization will be discussed in Sect. 3. In this section, the focus is on
the distribution of the different types of ferritin and the conservation of the catalytic
sites throughout the tree of life. The conservation of the secondary and quaternary
structures, and the primary sequence of the catalytic sites among different ferritins
is remarkably constant (Table 2.1), given the wide range of sequence differences.
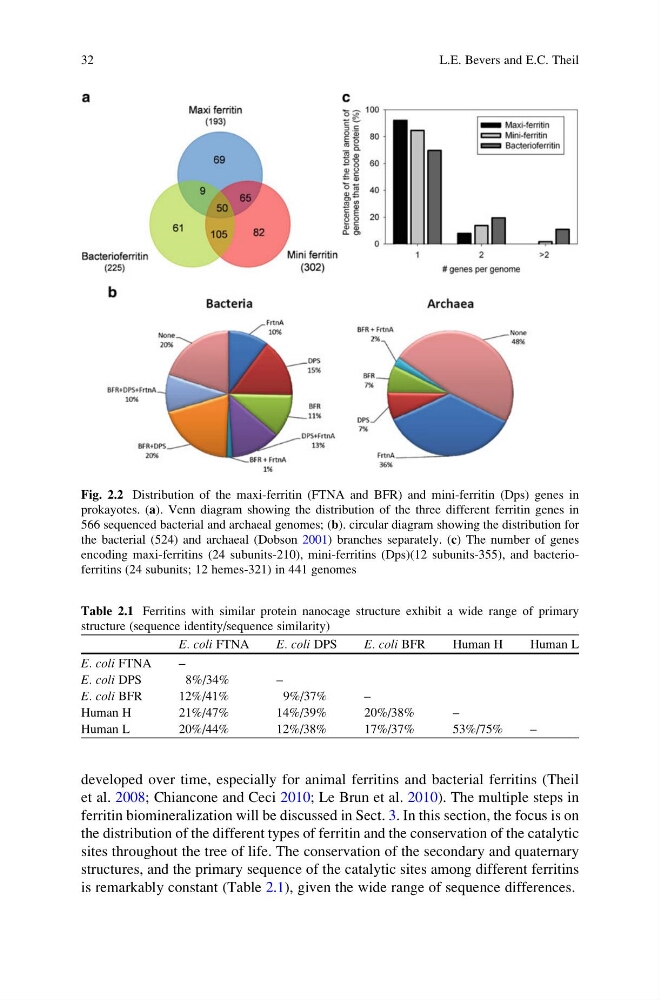
Fig. 2.2 Distribution of the maxi-ferritin (FTNA and BFR) and mini-ferritin (Dps) genes in
prokayotes. (a). Venn diagram showing the distribution of the three different ferritin genes in
566 sequenced bacterial and archaeal genomes; (b). circular diagram showing the distribution for
the bacterial (524) and archaeal (Dobson 2001) branches separately. (c) The number of genes
encoding maxi-ferritins (24 subunits-210), mini-ferritins (Dps)(12 subunits-355), and bacterioferritins (24 subunits; 12 hemes-321) in 441 genomes
Table 2.1 Ferritins with similar protein nanocage structure exhibit a wide range of primary
structure (sequence identity/sequence similarity)
E. coli FTNA
E. coli DPS
E. coli BFR
Human H
Human L
E. coli FTNA
–
E. coli DPS
8%/34%
–
E. coli BFR
12%/41%
9%/37%
–
Human H
21%/47%
14%/39%
20%/38%
–
Human L
20%/44%
12%/38%
17%/37%
53%/75%
–
32
L.E. Bevers and E.C. Theil
et al. 2008; Chiancone and Ceci 2010; Le Brun et al. 2010). The multiple steps in
ferritin biomineralization will be discussed in Sect. 3. In this section, the focus is on
the distribution of the different types of ferritin and the conservation of the catalytic
sites throughout the tree of life. The conservation of the secondary and quaternary
structures, and the primary sequence of the catalytic sites among different ferritins
is remarkably constant (Table 2.1), given the wide range of sequence differences.
Fig. 2.2 Distribution of the maxi-ferritin (FTNA and BFR) and mini-ferritin (Dps) genes in
prokayotes. (a). Venn diagram showing the distribution of the three different ferritin genes in
566 sequenced bacterial and archaeal genomes; (b). circular diagram showing the distribution for
the bacterial (524) and archaeal (Dobson 2001) branches separately. (c) The number of genes
encoding maxi-ferritins (24 subunits-210), mini-ferritins (Dps)(12 subunits-355), and bacterioferritins (24 subunits; 12 hemes-321) in 441 genomes
Table 2.1 Ferritins with similar protein nanocage structure exhibit a wide range of primary
structure (sequence identity/sequence similarity)
E. coli FTNA
E. coli DPS
E. coli BFR
Human H
Human L
E. coli FTNA
–
E. coli DPS
8%/34%
–
E. coli BFR
12%/41%
9%/37%
–
Human H
21%/47%
14%/39%
20%/38%
–
Human L
20%/44%
12%/38%
17%/37%
53%/75%
–
32
L.E. Bevers and E.C. Theil