

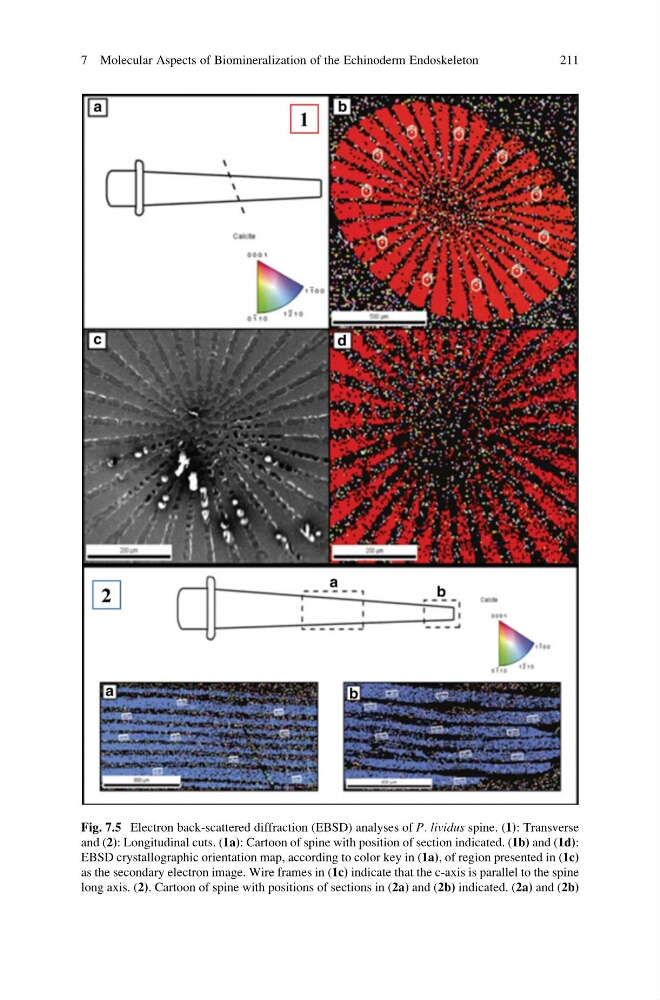
Fig. 7.5 Electron back-scattered diffraction (EBSD) analyses of P. lividus spine. (1): Transverse
and (2): Longitudinal cuts. (1a): Cartoon of spine with position of section indicated. (1b) and (1d):
EBSD crystallographic orientation map, according to color key in (1a), of region presented in (1c)
as the secondary electron image. Wire frames in (1c) indicate that the c-axis is parallel to the spine
long axis. (2). Cartoon of spine with positions of sections in (2a) and (2b) indicated. (2a) and (2b)
7 Molecular Aspects of Biomineralization of the Echinoderm Endoskeleton
211
and (2): Longitudinal cuts. (1a): Cartoon of spine with position of section indicated. (1b) and (1d):
EBSD crystallographic orientation map, according to color key in (1a), of region presented in (1c)
as the secondary electron image. Wire frames in (1c) indicate that the c-axis is parallel to the spine
long axis. (2). Cartoon of spine with positions of sections in (2a) and (2b) indicated. (2a) and (2b)
7 Molecular Aspects of Biomineralization of the Echinoderm Endoskeleton
211