

perpendicularly. In the inner two-thirds of the enamel, the varying complexity often
consists of orientation differences, which are generally referred to as “decussation.”
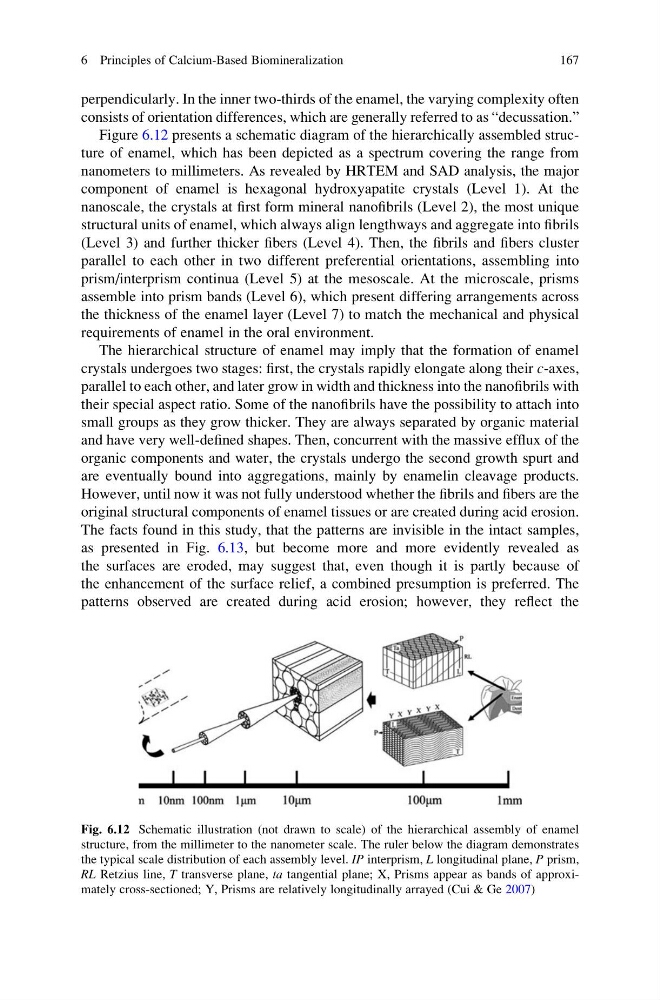
Figure 6.12 presents a schematic diagram of the hierarchically assembled structure of enamel, which has been depicted as a spectrum covering the range from
nanometers to millimeters. As revealed by HRTEM and SAD analysis, the major
component of enamel is hexagonal hydroxyapatite crystals (Level 1). At the
nanoscale, the crystals at first form mineral nanofibrils (Level 2), the most unique
structural units of enamel, which always align lengthways and aggregate into fibrils
(Level 3) and further thicker fibers (Level 4). Then, the fibrils and fibers cluster
parallel to each other in two different preferential orientations, assembling into
prism/interprism continua (Level 5) at the mesoscale. At the microscale, prisms
assemble into prism bands (Level 6), which present differing arrangements across
the thickness of the enamel layer (Level 7) to match the mechanical and physical
requirements of enamel in the oral environment.
The hierarchical structure of enamel may imply that the formation of enamel
crystals undergoes two stages: first, the crystals rapidly elongate along their c-axes,
parallel to each other, and later grow in width and thickness into the nanofibrils with
their special aspect ratio. Some of the nanofibrils have the possibility to attach into
small groups as they grow thicker. They are always separated by organic material
and have very well-defined shapes. Then, concurrent with the massive efflux of the
organic components and water, the crystals undergo the second growth spurt and
are eventually bound into aggregations, mainly by enamelin cleavage products.
However, until now it was not fully understood whether the fibrils and fibers are the
original structural components of enamel tissues or are created during acid erosion.
The facts found in this study, that the patterns are invisible in the intact samples,
as presented in Fig. 6.13, but become more and more evidently revealed as
the surfaces are eroded, may suggest that, even though it is partly because of
the enhancement of the surface relief, a combined presumption is preferred. The
patterns observed are created during acid erosion; however, they reflect the
Fig. 6.12 Schematic illustration (not drawn to scale) of the hierarchical assembly of enamel
structure, from the millimeter to the nanometer scale. The ruler below the diagram demonstrates
the typical scale distribution of each assembly level. IP interprism, L longitudinal plane, P prism,
RL Retzius line, T transverse plane, ta tangential plane; X, Prisms appear as bands of approximately cross-sectioned; Y, Prisms are relatively longitudinally arrayed (Cui & Ge 2007)
6 Principles of Calcium-Based Biomineralization
167
consists of orientation differences, which are generally referred to as “decussation.”
Figure 6.12 presents a schematic diagram of the hierarchically assembled structure of enamel, which has been depicted as a spectrum covering the range from
nanometers to millimeters. As revealed by HRTEM and SAD analysis, the major
component of enamel is hexagonal hydroxyapatite crystals (Level 1). At the
nanoscale, the crystals at first form mineral nanofibrils (Level 2), the most unique
structural units of enamel, which always align lengthways and aggregate into fibrils
(Level 3) and further thicker fibers (Level 4). Then, the fibrils and fibers cluster
parallel to each other in two different preferential orientations, assembling into
prism/interprism continua (Level 5) at the mesoscale. At the microscale, prisms
assemble into prism bands (Level 6), which present differing arrangements across
the thickness of the enamel layer (Level 7) to match the mechanical and physical
requirements of enamel in the oral environment.
The hierarchical structure of enamel may imply that the formation of enamel
crystals undergoes two stages: first, the crystals rapidly elongate along their c-axes,
parallel to each other, and later grow in width and thickness into the nanofibrils with
their special aspect ratio. Some of the nanofibrils have the possibility to attach into
small groups as they grow thicker. They are always separated by organic material
and have very well-defined shapes. Then, concurrent with the massive efflux of the
organic components and water, the crystals undergo the second growth spurt and
are eventually bound into aggregations, mainly by enamelin cleavage products.
However, until now it was not fully understood whether the fibrils and fibers are the
original structural components of enamel tissues or are created during acid erosion.
The facts found in this study, that the patterns are invisible in the intact samples,
as presented in Fig. 6.13, but become more and more evidently revealed as
the surfaces are eroded, may suggest that, even though it is partly because of
the enhancement of the surface relief, a combined presumption is preferred. The
patterns observed are created during acid erosion; however, they reflect the
Fig. 6.12 Schematic illustration (not drawn to scale) of the hierarchical assembly of enamel
structure, from the millimeter to the nanometer scale. The ruler below the diagram demonstrates
the typical scale distribution of each assembly level. IP interprism, L longitudinal plane, P prism,
RL Retzius line, T transverse plane, ta tangential plane; X, Prisms appear as bands of approximately cross-sectioned; Y, Prisms are relatively longitudinally arrayed (Cui & Ge 2007)
6 Principles of Calcium-Based Biomineralization
167