

76
Plankton in Coral-Reef Waters
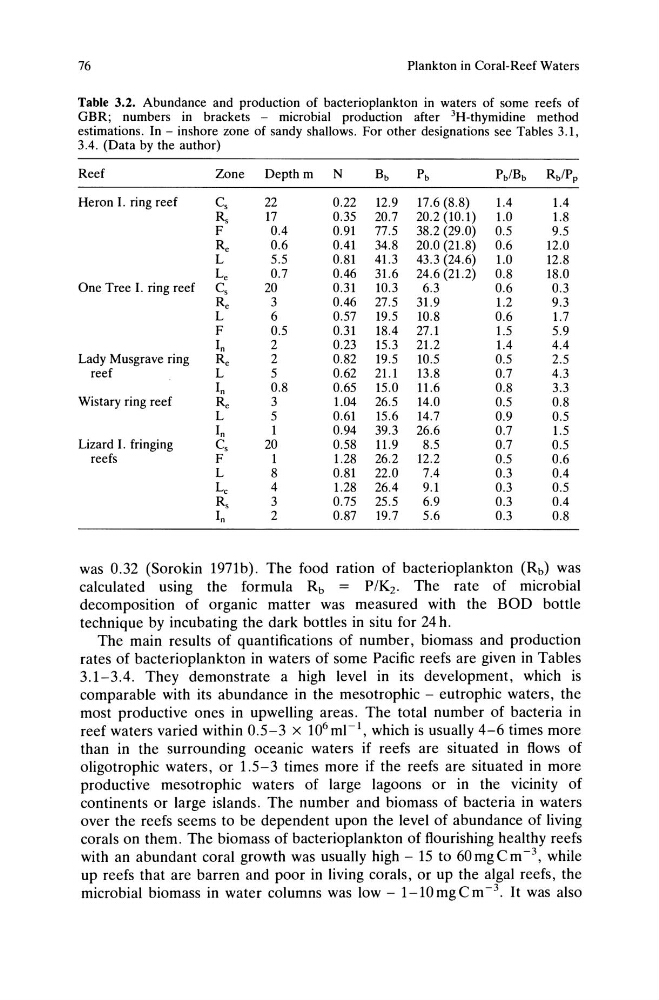
Table 3.2. Abundance and production of bacterioplankton in waters of some reefs of
GBR; numbers in brackets - microbial production after 3H-thymidine method
estimations. In - inshore zone of sandy shallows. For other designations see Tables 3.1,
3.4. (Data by the author)
Reef
Zone
Depth m
N
Bb
Pb
PblBb
Rb/Pp
Heron I. ring reef
Cs
22
0.22
12.9 17.6 (8.8)
1.4
1.4
Rs
17
0.35 20.7 20.2 (10.1)
1.0
1.8
F
0.4
0.91
77.5 38.2 (29.0)
0.5
9.5
Re
0.6
0.41
34.8 20.0 (21.8)
0.6
12.0
L
5.5
0.81
41.3 43.3 (24.6)
1.0
12.8
Le
0.7
0.46 31.6 24.6 (21.2)
0.8
18.0
One Tree I. ring reef
Cs
20
0.31
10.3
6.3
0.6
0.3
Re
3
0.46 27.5 31.9
1.2
9.3
L
6
0.57 19.5 10.8
0.6
1.7
F
0.5
0.31
18.4 27.1
1.5
5.9
In
2
0.23
15.3 21.2
1.4
4.4
Lady Musgrave ring
Re
2
0.82 19.5
10.5
0.5
2.5
reef
L
5
0.62 21.1
13.8
0.7
4.3
In
0.8
0.65
15.0 11.6
0.8
3.3
Wistary ring reef
Re
3
1.04 26.5 14.0
0.5
0.8
L
5
0.61
15.6 14.7
0.9
0.5
In
1
0.94 39.3 26.6
0.7
1.5
Lizard I. fringing
Cs
20
0.58 11.9
8.5
0.7
0.5
reefs
F
1
1.28 26.2
12.2
0.5
0.6
L
8
0.81
22.0
7.4
0.3
0.4
Lc
4
1.28 26.4
9.1
0.3
0.5
Rs
3
0.75 25.5
6.9
0.3
0.4
In
2
0.87 19.7
5.6
0.3
0.8
was 0.32 (Sorokin 1971 b). The food ration of bacterioplankton (Rb) was
calculated using the formula Rb
P/K2. The rate of microbial
decomposition of organic matter was measured with the BOD bottle
technique by incubating the dark bottles in situ for 24 h.
The main results of quantifications of number, biomass and production
rates of bacterioplankton in waters of some Pacific reefs are given in Tables
3.1-3.4. They demonstrate a high level in its development, which is
comparable with its abundance in the mesotrophic - eutrophic waters, the
most productive ones in upwelling areas. The total number of bacteria in
reef waters varied within 0.5-3 x 10 6 ml- 1 , which is usually 4-6 times more
than in the surrounding oceanic waters if reefs are situated in flows of
oligotrophic waters, or 1.5-3 times more if the reefs are situated in more
productive mesotrophic waters of large lagoons or in the vicinity of
continents or large islands. The number and biomass of bacteria in waters
over the reefs seems to be dependent upon the level of abundance of living
corals on them. The biomass of bacterioplankton of flourishing healthy reefs
with an abundant coral growth was usually high - 15 to 60 mg C m -3, while
up reefs that are barren and poor in living corals, or up the algal reefs, the
microbial biomass in water columns was low - 1-10 mg C m -3. It was also
Plankton in Coral-Reef Waters
Table 3.2. Abundance and production of bacterioplankton in waters of some reefs of
GBR; numbers in brackets - microbial production after 3H-thymidine method
estimations. In - inshore zone of sandy shallows. For other designations see Tables 3.1,
3.4. (Data by the author)
Reef
Zone
Depth m
N
Bb
Pb
PblBb
Rb/Pp
Heron I. ring reef
Cs
22
0.22
12.9 17.6 (8.8)
1.4
1.4
Rs
17
0.35 20.7 20.2 (10.1)
1.0
1.8
F
0.4
0.91
77.5 38.2 (29.0)
0.5
9.5
Re
0.6
0.41
34.8 20.0 (21.8)
0.6
12.0
L
5.5
0.81
41.3 43.3 (24.6)
1.0
12.8
Le
0.7
0.46 31.6 24.6 (21.2)
0.8
18.0
One Tree I. ring reef
Cs
20
0.31
10.3
6.3
0.6
0.3
Re
3
0.46 27.5 31.9
1.2
9.3
L
6
0.57 19.5 10.8
0.6
1.7
F
0.5
0.31
18.4 27.1
1.5
5.9
In
2
0.23
15.3 21.2
1.4
4.4
Lady Musgrave ring
Re
2
0.82 19.5
10.5
0.5
2.5
reef
L
5
0.62 21.1
13.8
0.7
4.3
In
0.8
0.65
15.0 11.6
0.8
3.3
Wistary ring reef
Re
3
1.04 26.5 14.0
0.5
0.8
L
5
0.61
15.6 14.7
0.9
0.5
In
1
0.94 39.3 26.6
0.7
1.5
Lizard I. fringing
Cs
20
0.58 11.9
8.5
0.7
0.5
reefs
F
1
1.28 26.2
12.2
0.5
0.6
L
8
0.81
22.0
7.4
0.3
0.4
Lc
4
1.28 26.4
9.1
0.3
0.5
Rs
3
0.75 25.5
6.9
0.3
0.4
In
2
0.87 19.7
5.6
0.3
0.8
was 0.32 (Sorokin 1971 b). The food ration of bacterioplankton (Rb) was
calculated using the formula Rb
P/K2. The rate of microbial
decomposition of organic matter was measured with the BOD bottle
technique by incubating the dark bottles in situ for 24 h.
The main results of quantifications of number, biomass and production
rates of bacterioplankton in waters of some Pacific reefs are given in Tables
3.1-3.4. They demonstrate a high level in its development, which is
comparable with its abundance in the mesotrophic - eutrophic waters, the
most productive ones in upwelling areas. The total number of bacteria in
reef waters varied within 0.5-3 x 10 6 ml- 1 , which is usually 4-6 times more
than in the surrounding oceanic waters if reefs are situated in flows of
oligotrophic waters, or 1.5-3 times more if the reefs are situated in more
productive mesotrophic waters of large lagoons or in the vicinity of
continents or large islands. The number and biomass of bacteria in waters
over the reefs seems to be dependent upon the level of abundance of living
corals on them. The biomass of bacterioplankton of flourishing healthy reefs
with an abundant coral growth was usually high - 15 to 60 mg C m -3, while
up reefs that are barren and poor in living corals, or up the algal reefs, the
microbial biomass in water columns was low - 1-10 mg C m -3. It was also