

354
Nutrition of Corals
compensation for the general energy demand of corals. Witin a real range of
zooplankton biomass of 0.3-2gm- 3 on the reef at night, these shares
(AIMG ratios), in accordance with this curve (Fig. 9.5), should be 10 to
30%. At the Heron Island reefs, where these experiments had been
performed, the zooplankton biomass at night was 0.5-1 gm- 3 . In
accordance with this curve, corals by means of predatory feeding could
compensate there 10-20% of their total energy demand.
The sedimentary filter feeding of corals with bacteria was first established
by Di Salvo (1971a, 1973). After exposing corals for 10-12 h to the presence
of suspended bacteria labeled with the redioisotope 35S, he discovered
30-40% of the tadioactivity inserted into the aquaria in the tissues of
polyps. Quantitative estimations of coral's feeding on bacteria labeled with
14C we have done at the reefs of Kaneohe bay (Sorokin 1973c, 1978b) and of
the Heron Island reefs (Sorokin 1981c, 1984a). The experiments were
conducted with natural labeled bacterioplankton in concentration close to its
upper level in reef waters: 1.5-3 x 10 6 cellsml- 1 . The results of the
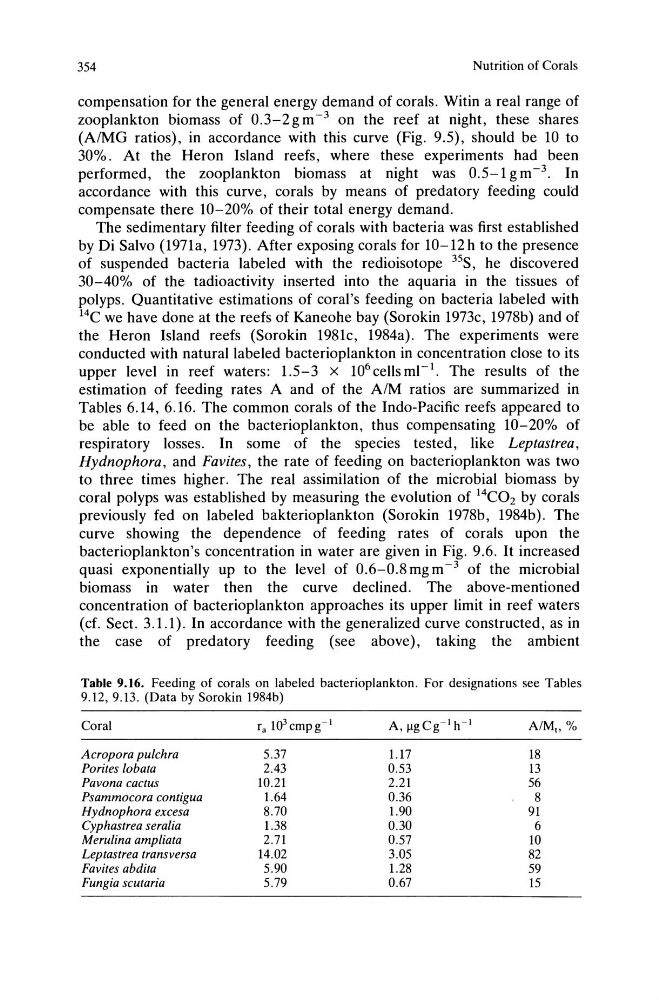
estimation of feeding rates A and of the AIM ratios are summarized in
Tables 6.14, 6.16. The common corals of the Indo-Pacific reefs appeared to
be able to feed on the bacterioplankton, thus compensating 10-20% of
respiratory losses. In some of the species tested, like Leptastrea,
Hydnophora, and Favites, the rate of feeding on bacterioplankton was two
to three times higher. The real assimilation of the microbial biomass by
coral polyps was established by measuring the evolution of 14C02 by corals
previously fed on labeled bakterioplankton (Sorokin 1978b, 1984b). The
curve showing the dependence of feeding rates of corals upon the
bacterioplankton's concentration in water are given in Fig. 9.6. It increased
quasi exponentially up to the level of 0.6-0.8 mg m -3 of the microbial
biomass in water then the curve declined. The above-mentioned
concentration of bacterioplankton approaches its upper limit in reef waters
(ct. Sect. 3.1.1). In accordance with the generalized curve constructed, as in
the case of predatory feeding (see above), taking the ambient
Table 9.16. Feeding of corals on labeled bacterioplankton. For designations see Tables
9.12,9.13. (Data by Sorokin 1984b)
Coral
ra 10 3 cmpg-l
A, J.lgCg- 1 h- 1
AIM" %
Acropora pulchra
5.37
1.17
18
Porites lobata
2.43
0.53
13
Pavona cactus
10.21
2.21
56
Psammocora contigua
1.64
0.36
8
Hydnophora excesa
8.70
1.90
91
Cyphastrea seralia
1.38
0.30
6
Merulina ampliata
2.71
0.57
10
Leptastrea transversa
14.02
3.05
82
Favites abdita
5.90
1.28
59
Fungia scuta ria
5.79
0.67
15
Nutrition of Corals
compensation for the general energy demand of corals. Witin a real range of
zooplankton biomass of 0.3-2gm- 3 on the reef at night, these shares
(AIMG ratios), in accordance with this curve (Fig. 9.5), should be 10 to
30%. At the Heron Island reefs, where these experiments had been
performed, the zooplankton biomass at night was 0.5-1 gm- 3 . In
accordance with this curve, corals by means of predatory feeding could
compensate there 10-20% of their total energy demand.
The sedimentary filter feeding of corals with bacteria was first established
by Di Salvo (1971a, 1973). After exposing corals for 10-12 h to the presence
of suspended bacteria labeled with the redioisotope 35S, he discovered
30-40% of the tadioactivity inserted into the aquaria in the tissues of
polyps. Quantitative estimations of coral's feeding on bacteria labeled with
14C we have done at the reefs of Kaneohe bay (Sorokin 1973c, 1978b) and of
the Heron Island reefs (Sorokin 1981c, 1984a). The experiments were
conducted with natural labeled bacterioplankton in concentration close to its
upper level in reef waters: 1.5-3 x 10 6 cellsml- 1 . The results of the
estimation of feeding rates A and of the AIM ratios are summarized in
Tables 6.14, 6.16. The common corals of the Indo-Pacific reefs appeared to
be able to feed on the bacterioplankton, thus compensating 10-20% of
respiratory losses. In some of the species tested, like Leptastrea,
Hydnophora, and Favites, the rate of feeding on bacterioplankton was two
to three times higher. The real assimilation of the microbial biomass by
coral polyps was established by measuring the evolution of 14C02 by corals
previously fed on labeled bakterioplankton (Sorokin 1978b, 1984b). The
curve showing the dependence of feeding rates of corals upon the
bacterioplankton's concentration in water are given in Fig. 9.6. It increased
quasi exponentially up to the level of 0.6-0.8 mg m -3 of the microbial
biomass in water then the curve declined. The above-mentioned
concentration of bacterioplankton approaches its upper limit in reef waters
(ct. Sect. 3.1.1). In accordance with the generalized curve constructed, as in
the case of predatory feeding (see above), taking the ambient
Table 9.16. Feeding of corals on labeled bacterioplankton. For designations see Tables
9.12,9.13. (Data by Sorokin 1984b)
Coral
ra 10 3 cmpg-l
A, J.lgCg- 1 h- 1
AIM" %
Acropora pulchra
5.37
1.17
18
Porites lobata
2.43
0.53
13
Pavona cactus
10.21
2.21
56
Psammocora contigua
1.64
0.36
8
Hydnophora excesa
8.70
1.90
91
Cyphastrea seralia
1.38
0.30
6
Merulina ampliata
2.71
0.57
10
Leptastrea transversa
14.02
3.05
82
Favites abdita
5.90
1.28
59
Fungia scuta ria
5.79
0.67
15