

228
Leeward
reef
outer slope
Lagoona l
patch
reefs
Reef flat
Windward
reef edge
Windward
reef slope
Coral Reef Fish
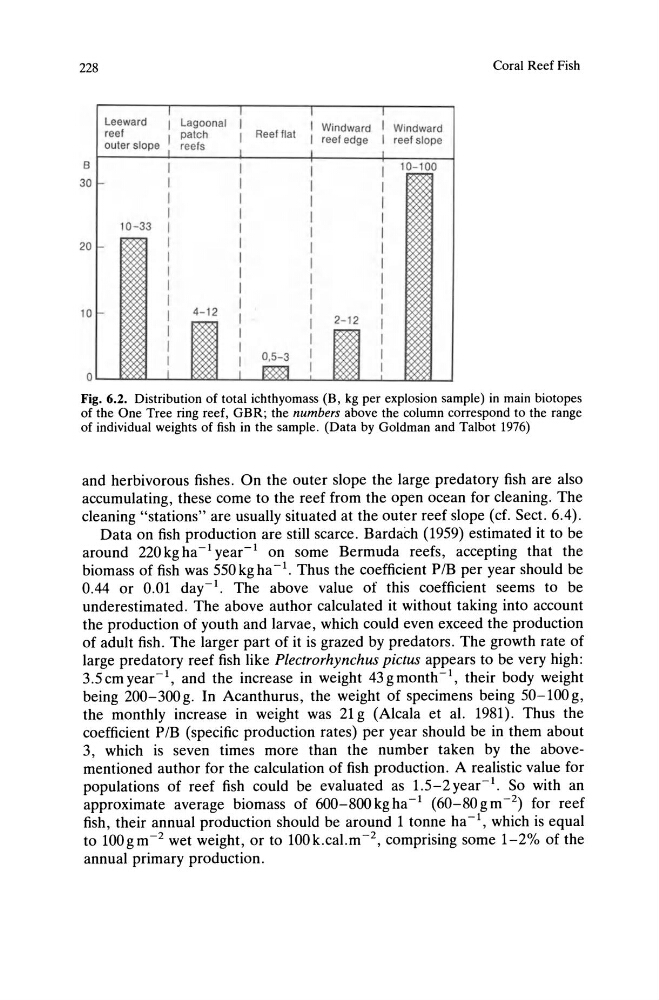
Fig. 6.2. Distribution of total ichthyomass (B, kg per explosion sample) in main biotopes
of the One Tree ring reef, GBR; the numbers above the column correspond to the range
of individual weights of fish in the sample . (Data by Goldman and Talbot 1976)
and herbivorous fishes. On the outer slope the large predatory fish are also
accumulating, these come to the reef from the open ocean for cleaning. The
cleaning "stations" are usually situated at the outer reef slope (cf. Sect. 6.4).
Data on fish production are still scarce. Bardach (1959) estimated it to be
around 220 kg ha -1 year-Ion some Bermuda reefs, accepting that the
biomass of fish was 550 kg ha -1. Thus the coefficient P IB per year should be
0.44 or 0.01 day-I. The above value of this coefficient seems to be
underestimated. The above author calculated it without taking into account
the production of youth and larvae, which could even exceed the production
of adult fish. The larger part of it is grazed by predators. The growth rate of
large predatory reef fish like Plectrorhynchus pictus appears to be very high:
3.5cmyear- I , and the increase in weight 43gmonth-I, their body weight
being 200-300 g. In Acanthurus, the weight of specimens being 50-100 g,
the monthly increase in weight was 21 g (Alcala et al. 1981). Thus the
coefficient PIB (specific production rates) per year should be in them about
3, which is seven times more than the number taken by the abovementioned author for the calculation of fish production. A realistic value for
populations of reef fish could be evaluated as 1.5-2year- I . So with an
approximate average biomass of 600-800kgha- I (60-80gm-2) for reef
fish, their annual production should be around 1 tonne ha- I , which is equal
to 100gm- 2 wet weight, or to 100k.cal.m- 2 , comprising some 1-2% of the
annual primary production.
Leeward
reef
outer slope
Lagoona l
patch
reefs
Reef flat
Windward
reef edge
Windward
reef slope
Coral Reef Fish
Fig. 6.2. Distribution of total ichthyomass (B, kg per explosion sample) in main biotopes
of the One Tree ring reef, GBR; the numbers above the column correspond to the range
of individual weights of fish in the sample . (Data by Goldman and Talbot 1976)
and herbivorous fishes. On the outer slope the large predatory fish are also
accumulating, these come to the reef from the open ocean for cleaning. The
cleaning "stations" are usually situated at the outer reef slope (cf. Sect. 6.4).
Data on fish production are still scarce. Bardach (1959) estimated it to be
around 220 kg ha -1 year-Ion some Bermuda reefs, accepting that the
biomass of fish was 550 kg ha -1. Thus the coefficient P IB per year should be
0.44 or 0.01 day-I. The above value of this coefficient seems to be
underestimated. The above author calculated it without taking into account
the production of youth and larvae, which could even exceed the production
of adult fish. The larger part of it is grazed by predators. The growth rate of
large predatory reef fish like Plectrorhynchus pictus appears to be very high:
3.5cmyear- I , and the increase in weight 43gmonth-I, their body weight
being 200-300 g. In Acanthurus, the weight of specimens being 50-100 g,
the monthly increase in weight was 21 g (Alcala et al. 1981). Thus the
coefficient PIB (specific production rates) per year should be in them about
3, which is seven times more than the number taken by the abovementioned author for the calculation of fish production. A realistic value for
populations of reef fish could be evaluated as 1.5-2year- I . So with an
approximate average biomass of 600-800kgha- I (60-80gm-2) for reef
fish, their annual production should be around 1 tonne ha- I , which is equal
to 100gm- 2 wet weight, or to 100k.cal.m- 2 , comprising some 1-2% of the
annual primary production.