

water depth, the result is usually a decreased tidal range.
(See Tidal and Nontidal Oscillation; see also Parker,
2007, for a mathematical treatment of this interaction.)
Tidal effects on mean sea level: another
nonlinear effect
Tidal heights are referenced to some type of datum, typically the mean level of a particular key point on the tide
curve. Datums such as mean lower low water (MLLW)
or mean high water (MHW) or mean tide level (MTL)
are usually calculated by averaging over 19 years of data
(to eliminate the 18.6-year lunar nodal variations as well
as meteorologically caused noise). Such datums may
slowly change over the years due to a change in sea level
(due to climate change) or due to slow vertical land movement (e.g., due to glacial rebound or sediment compaction), the latter looking like a sea level change because
the water level gauge is mounted on the moving land.
All the datums slowly move up and down with the longterm changes in relative sea level.
However, in shallow-water areas, there can also be
a tidally induced change in “mean sea level” due to
nonlinear tidal effects. In this case, what looks like
a “mean” result comes from averaging an asymmetry
within a tidal cycle caused by the nonlinear effects, rather
than from a uniform shifting up or down of the water level
on which the tide propagates. But this is an effect that is
still included in the datum calculation. It is therefore an
effect that should be considered when assessing long-term
changes in sea level in a shallow-water area, since something as simple as dredging or shoaling can change the
tidal hydrodynamics of a waterway and then also affect
the value of mean sea level (and thus all the tidal datums).
As one example, in the Delaware River and Bay, shallowwater nonlinear effects increase the mean sea level value
near Philadelphia by an amount equivalent to 8 % of the
M 2 amplitude at the entrance to the bay (Parker, 2007).
Tidal currents do not require datums, the zero current
speed serving that purpose (if there is no mean current
from a nontidal source). If there is a mean permanent current, such as due to a mean river flow or a mean wind drift,
then the tidal current oscillates about that mean flow. Or,
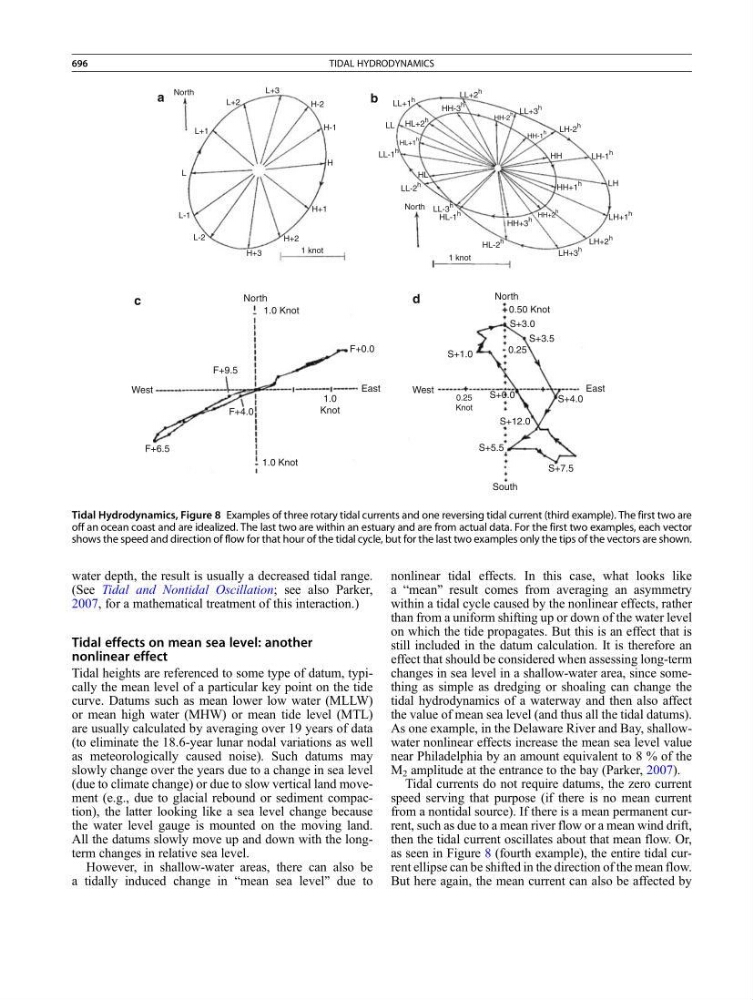
as seen in Figure 8 (fourth example), the entire tidal current ellipse can be shifted in the direction of the mean flow.
But here again, the mean current can also be affected by
North
North
L+2
L+3
H-2
H-1
H+1
H+2
1 knot
1 knot
H+3
North
West
1.0 Knot
1.0 Knot
F+0.0
S+3.0
S+3.5
S+1.0
a
b
c
d
S+0.0
S+5.5
S+12.0
S+4.0
S+7.5
0.25
Knot
0.25
F+9.5
F+4.0
F+6.5
East
North
0.50 Knot
West
South
East
1.0
Knot
L-2
L-1
L+1
L
H
HL
LL-1
h
LL-2
h
LL-3
h
HL-1
h
HL-2
h
HH+3
h
HH+1
h
LH+3
h
LH+2
h
LH+1
h
LH-1
h
LH-2
h
HH
LL+3
h
LL+2
h
LH
LL+1
h
HL+2
h
HH-3
h
HL+1
h
HH-2
h
HH-1
h
HH+2
h
LL
Tidal Hydrodynamics, Figure 8 Examples of three rotary tidal currents and one reversing tidal current (third example). The first two are
off an ocean coast and are idealized. The last two are within an estuary and are from actual data. For the first two examples, each vector
shows the speed and direction of flow for that hour of the tidal cycle, but for the last two examples only the tips of the vectors are shown.
696
TIDAL HYDRODYNAMICS