

[x10 –3 mol/1]
SUPERSATURATED
a
b
D
C
A
D′
C′
B
UNDERSATURATED
T = 20°C
(after Dreybrodt, 2000)
3
2
[Ca
++
]
1
0
0
1
2
[H 2 CO 3 *]
*[x10 –3 mol/1]
3
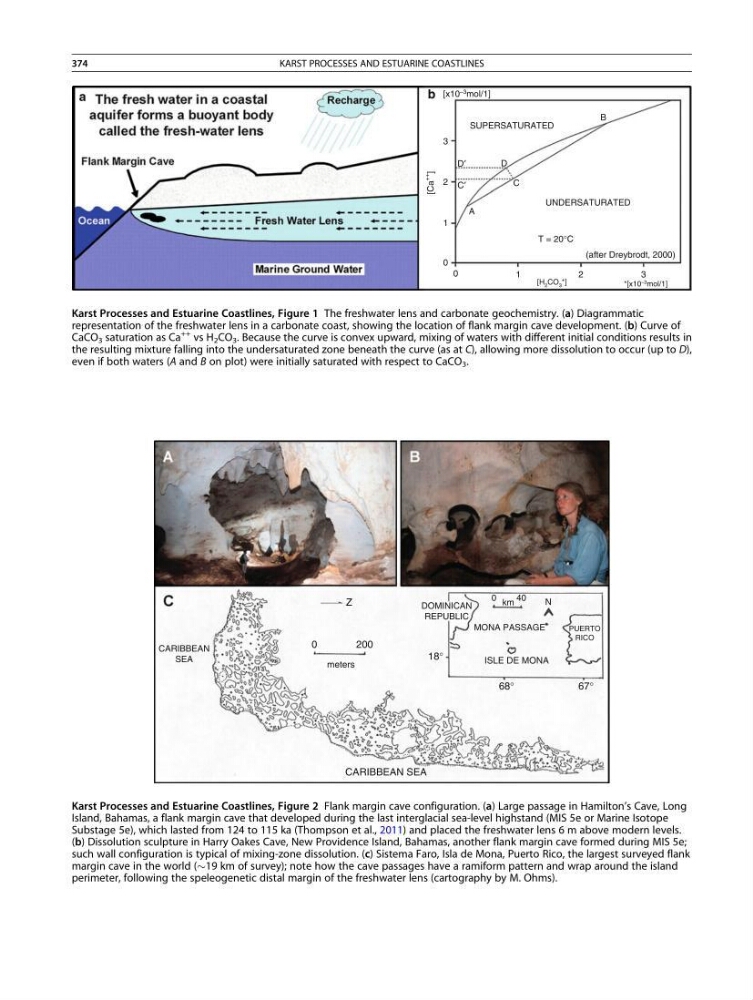
Karst Processes and Estuarine Coastlines, Figure 1 The freshwater lens and carbonate geochemistry. (a) Diagrammatic
representation of the freshwater lens in a carbonate coast, showing the location of flank margin cave development. (b) Curve of
CaCO 3 saturation as Ca
++ vs H 2 CO 3 . Because the curve is convex upward, mixing of waters with different initial conditions results in
the resulting mixture falling into the undersaturated zone beneath the curve (as at C), allowing more dissolution to occur (up to D),
even if both waters (A and B on plot) were initially saturated with respect to CaCO 3 .
CARIBBEAN
SEA
0
200
Z
DOMINICAN
REPUBLIC
meters
CARIBBEAN SEA
0
4 0
km
N
MONA PASSAGE
PUERTO
RICO
ISLE DE MONA
18°
68°
67°
Karst Processes and Estuarine Coastlines, Figure 2 Flank margin cave configuration. (a) Large passage in Hamilton’s Cave, Long
Island, Bahamas, a flank margin cave that developed during the last interglacial sea-level highstand (MIS 5e or Marine Isotope
Substage 5e), which lasted from 124 to 115 ka (Thompson et al., 2011) and placed the freshwater lens 6 m above modern levels.
(b) Dissolution sculpture in Harry Oakes Cave, New Providence Island, Bahamas, another flank margin cave formed during MIS 5e;
such wall configuration is typical of mixing-zone dissolution. (c) Sistema Faro, Isla de Mona, Puerto Rico, the largest surveyed flank
margin cave in the world (19 km of survey); note how the cave passages have a ramiform pattern and wrap around the island
perimeter, following the speleogenetic distal margin of the freshwater lens (cartography by M. Ohms).
374
KARST PROCESSES AND ESTUARINE COASTLINES
SUPERSATURATED
a
b
D
C
A
D′
C′
B
UNDERSATURATED
T = 20°C
(after Dreybrodt, 2000)
3
2
[Ca
++
]
1
0
0
1
2
[H 2 CO 3 *]
*[x10 –3 mol/1]
3
Karst Processes and Estuarine Coastlines, Figure 1 The freshwater lens and carbonate geochemistry. (a) Diagrammatic
representation of the freshwater lens in a carbonate coast, showing the location of flank margin cave development. (b) Curve of
CaCO 3 saturation as Ca
++ vs H 2 CO 3 . Because the curve is convex upward, mixing of waters with different initial conditions results in
the resulting mixture falling into the undersaturated zone beneath the curve (as at C), allowing more dissolution to occur (up to D),
even if both waters (A and B on plot) were initially saturated with respect to CaCO 3 .
CARIBBEAN
SEA
0
200
Z
DOMINICAN
REPUBLIC
meters
CARIBBEAN SEA
0
4 0
km
N
MONA PASSAGE
PUERTO
RICO
ISLE DE MONA
18°
68°
67°
Karst Processes and Estuarine Coastlines, Figure 2 Flank margin cave configuration. (a) Large passage in Hamilton’s Cave, Long
Island, Bahamas, a flank margin cave that developed during the last interglacial sea-level highstand (MIS 5e or Marine Isotope
Substage 5e), which lasted from 124 to 115 ka (Thompson et al., 2011) and placed the freshwater lens 6 m above modern levels.
(b) Dissolution sculpture in Harry Oakes Cave, New Providence Island, Bahamas, another flank margin cave formed during MIS 5e;
such wall configuration is typical of mixing-zone dissolution. (c) Sistema Faro, Isla de Mona, Puerto Rico, the largest surveyed flank
margin cave in the world (19 km of survey); note how the cave passages have a ramiform pattern and wrap around the island
perimeter, following the speleogenetic distal margin of the freshwater lens (cartography by M. Ohms).
374
KARST PROCESSES AND ESTUARINE COASTLINES