

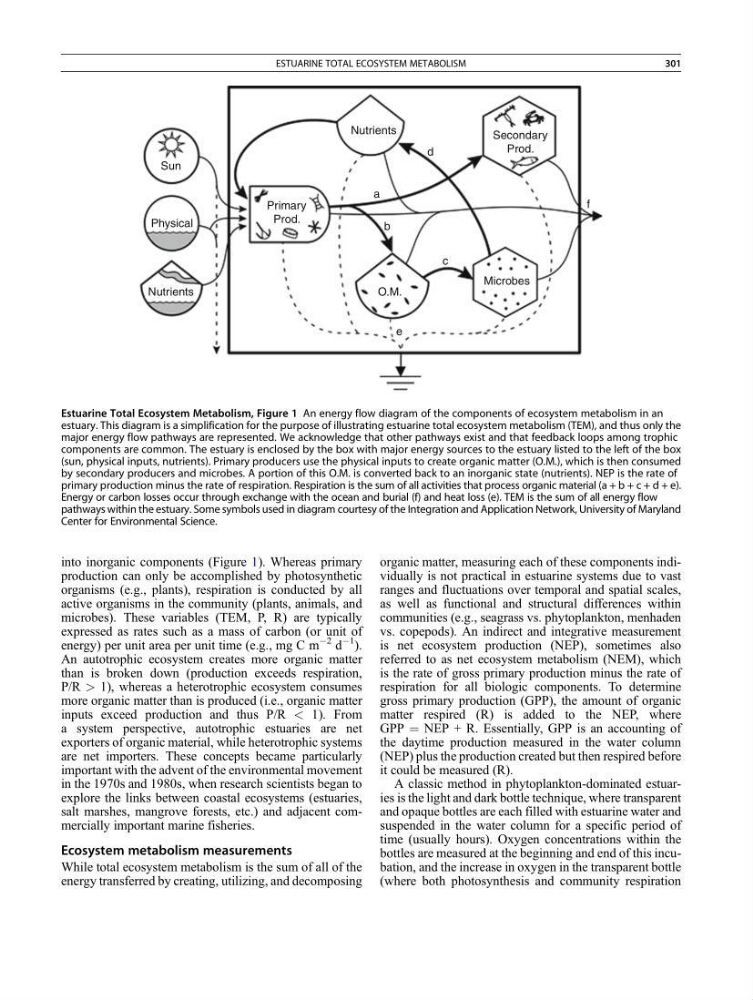
into inorganic components (Figure 1). Whereas primary
production can only be accomplished by photosynthetic
organisms (e.g., plants), respiration is conducted by all
active organisms in the community (plants, animals, and
microbes). These variables (TEM, P, R) are typically
expressed as rates such as a mass of carbon (or unit of
energy) per unit area per unit time (e.g., mg C m
À2 d
À1
).
An autotrophic ecosystem creates more organic matter
than is broken down (production exceeds respiration,
P/R > 1), whereas a heterotrophic ecosystem consumes
more organic matter than is produced (i.e., organic matter
inputs exceed production and thus P/R < 1). From
a system perspective, autotrophic estuaries are net
exporters of organic material, while heterotrophic systems
are net importers. These concepts became particularly
important with the advent of the environmental movement
in the 1970s and 1980s, when research scientists began to
explore the links between coastal ecosystems (estuaries,
salt marshes, mangrove forests, etc.) and adjacent commercially important marine fisheries.
Ecosystem metabolism measurements
While total ecosystem metabolism is the sum of all of the
energy transferred by creating, utilizing, and decomposing
organic matter, measuring each of these components individually is not practical in estuarine systems due to vast
ranges and fluctuations over temporal and spatial scales,
as well as functional and structural differences within
communities (e.g., seagrass vs. phytoplankton, menhaden
vs. copepods). An indirect and integrative measurement
is net ecosystem production (NEP), sometimes also
referred to as net ecosystem metabolism (NEM), which
is the rate of gross primary production minus the rate of
respiration for all biologic components. To determine
gross primary production (GPP), the amount of organic
matter respired (R) is added to the NEP, where
GPP ¼ NEP + R. Essentially, GPP is an accounting of
the daytime production measured in the water column
(NEP) plus the production created but then respired before
it could be measured (R).
A classic method in phytoplankton-dominated estuaries is the light and dark bottle technique, where transparent
and opaque bottles are each filled with estuarine water and
suspended in the water column for a specific period of
time (usually hours). Oxygen concentrations within the
bottles are measured at the beginning and end of this incubation, and the increase in oxygen in the transparent bottle
(where both photosynthesis and community respiration
Sun
Physical
Nutrients
Primary
Prod.
Nutrients
a
b
c
d
f
O.M.
e
Microbes
Secondary
Prod.
Estuarine Total Ecosystem Metabolism, Figure 1 An energy flow diagram of the components of ecosystem metabolism in an
estuary. This diagram is a simplification for the purpose of illustrating estuarine total ecosystem metabolism (TEM), and thus only the
major energy flow pathways are represented. We acknowledge that other pathways exist and that feedback loops among trophic
components are common. The estuary is enclosed by the box with major energy sources to the estuary listed to the left of the box
(sun, physical inputs, nutrients). Primary producers use the physical inputs to create organic matter (O.M.), which is then consumed
by secondary producers and microbes. A portion of this O.M. is converted back to an inorganic state (nutrients). NEP is the rate of
primary production minus the rate of respiration. Respiration is the sum of all activities that process organic material (a + b + c + d + e).
Energy or carbon losses occur through exchange with the ocean and burial (f) and heat loss (e). TEM is the sum of all energy flow
pathways within the estuary. Some symbols used in diagram courtesy of the Integration and Application Network, University of Maryland
Center for Environmental Science.
ESTUARINE TOTAL ECOSYSTEM METABOLISM
301
production can only be accomplished by photosynthetic
organisms (e.g., plants), respiration is conducted by all
active organisms in the community (plants, animals, and
microbes). These variables (TEM, P, R) are typically
expressed as rates such as a mass of carbon (or unit of
energy) per unit area per unit time (e.g., mg C m
À2 d
À1
).
An autotrophic ecosystem creates more organic matter
than is broken down (production exceeds respiration,
P/R > 1), whereas a heterotrophic ecosystem consumes
more organic matter than is produced (i.e., organic matter
inputs exceed production and thus P/R < 1). From
a system perspective, autotrophic estuaries are net
exporters of organic material, while heterotrophic systems
are net importers. These concepts became particularly
important with the advent of the environmental movement
in the 1970s and 1980s, when research scientists began to
explore the links between coastal ecosystems (estuaries,
salt marshes, mangrove forests, etc.) and adjacent commercially important marine fisheries.
Ecosystem metabolism measurements
While total ecosystem metabolism is the sum of all of the
energy transferred by creating, utilizing, and decomposing
organic matter, measuring each of these components individually is not practical in estuarine systems due to vast
ranges and fluctuations over temporal and spatial scales,
as well as functional and structural differences within
communities (e.g., seagrass vs. phytoplankton, menhaden
vs. copepods). An indirect and integrative measurement
is net ecosystem production (NEP), sometimes also
referred to as net ecosystem metabolism (NEM), which
is the rate of gross primary production minus the rate of
respiration for all biologic components. To determine
gross primary production (GPP), the amount of organic
matter respired (R) is added to the NEP, where
GPP ¼ NEP + R. Essentially, GPP is an accounting of
the daytime production measured in the water column
(NEP) plus the production created but then respired before
it could be measured (R).
A classic method in phytoplankton-dominated estuaries is the light and dark bottle technique, where transparent
and opaque bottles are each filled with estuarine water and
suspended in the water column for a specific period of
time (usually hours). Oxygen concentrations within the
bottles are measured at the beginning and end of this incubation, and the increase in oxygen in the transparent bottle
(where both photosynthesis and community respiration
Sun
Physical
Nutrients
Primary
Prod.
Nutrients
a
b
c
d
f
O.M.
e
Microbes
Secondary
Prod.
Estuarine Total Ecosystem Metabolism, Figure 1 An energy flow diagram of the components of ecosystem metabolism in an
estuary. This diagram is a simplification for the purpose of illustrating estuarine total ecosystem metabolism (TEM), and thus only the
major energy flow pathways are represented. We acknowledge that other pathways exist and that feedback loops among trophic
components are common. The estuary is enclosed by the box with major energy sources to the estuary listed to the left of the box
(sun, physical inputs, nutrients). Primary producers use the physical inputs to create organic matter (O.M.), which is then consumed
by secondary producers and microbes. A portion of this O.M. is converted back to an inorganic state (nutrients). NEP is the rate of
primary production minus the rate of respiration. Respiration is the sum of all activities that process organic material (a + b + c + d + e).
Energy or carbon losses occur through exchange with the ocean and burial (f) and heat loss (e). TEM is the sum of all energy flow
pathways within the estuary. Some symbols used in diagram courtesy of the Integration and Application Network, University of Maryland
Center for Environmental Science.
ESTUARINE TOTAL ECOSYSTEM METABOLISM
301