

where f D and f A are the salt flux into the estuary due to
turbulent diffusion and the advection, respectively. When
f D >> f A , it follows that u ! 1 and the salt flux are
dominated by the tidal mixing; for f D << f A , u ! 0 and
the salt flux is dominated by advection (gravitational
circulation). Then, this parameter varies from 0 to 1, and
u ¼ u(p c , p e ) is expressed theoretically by Miranda
et al. (2012):
p e
ð Þ
À1 210 þ 252 p c À 1:5
ð
Þ
½
u
2
þ 32 À p e
ð Þ
À1 210 þ 252 p c À 1:5
ð
Þ
ð
Þ
h
þ 76 p c À 1:5
ð
Þ
þ
152
3
p c À 1:5
ð
Þ
2
i
u ¼ 0;
ð1Þ
For u ¼ 0 (1) has no physical meaning, and for u ¼ 1 the
salt transport is due to the turbulent diffusion only.
The equation is thus reduced to:
32 þ 76 p c À 1:5
ð
Þþ
152
3
p c À 1:5
ð
Þ
2 ¼ 0
ð2Þ
This equation with the unknown (p c À1.5) has no solution
in the field, unless the constant 32 is disregarded. If so, it
has two solutions: p c ¼ 0 (with no physical meaning)
and p c ¼ 1.5, which indicates that when the salt flux is
due to the turbulent diffusion (u ¼ 1), its solution is independent of the stratification parameter (p e ). Under this
simplification, it is possible (1) to define a set of isolines
in a Cartesian Coordinate system (p e  p c ) with u ¼ cte
and interval 0 < u 1.
Hansen and Rattray (1966) confirmed that theory by
analyzing an experimental data set from several estuaries,
from which four previously classified estuarine types
emerged: (1) Type 1, well-mixed estuary (unidirectional
circulation); (2) Type 2, partially mixed estuary
(circulation reverses at depth); (3) Type 3, fjords; and
(4) Type 4, salt-wedge estuary. Types 3 and 4 were classified because their experimental data fits very well in the
stratification-circulation diagram. Subdivisions a and
b for Types 1, 2, and 3 are low and high stratification when
p e < 0.1 and p e > 0.1, respectively.
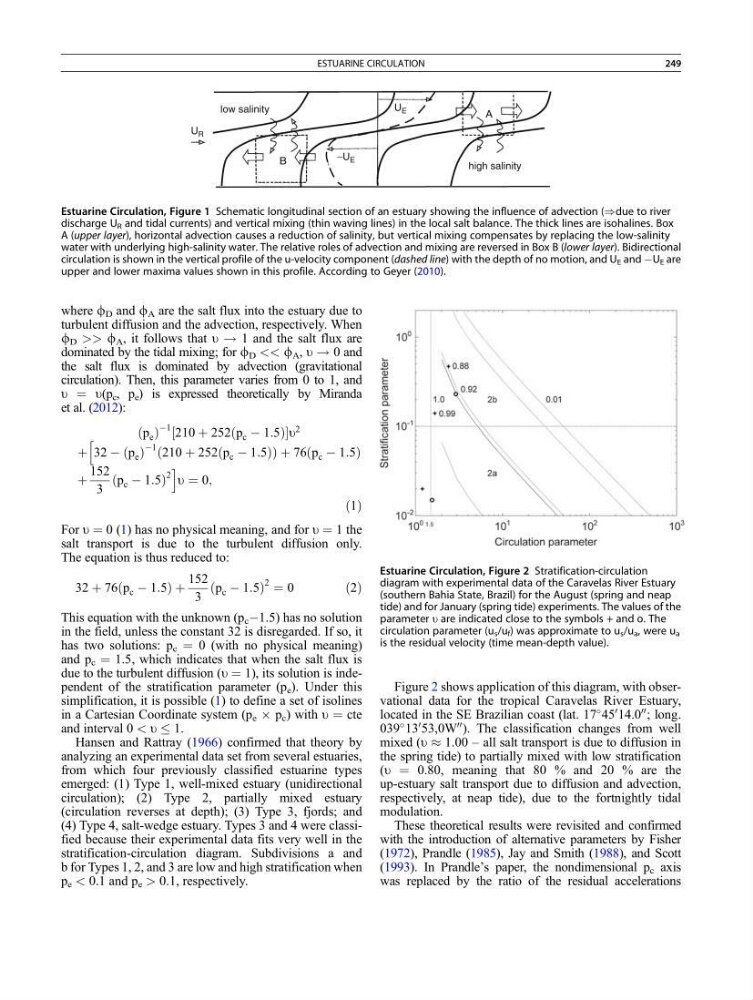
Figure 2 shows application of this diagram, with observational data for the tropical Caravelas River Estuary,
located in the SE Brazilian coast (lat. 17
45
0 14.0
00 ; long.
039
13
0 53,0W
00 ). The classification changes from well
mixed (u % 1.00 – all salt transport is due to diffusion in
the spring tide) to partially mixed with low stratification
(u ¼ 0.80, meaning that 80 % and 20 % are the
up-estuary salt transport due to diffusion and advection,
respectively, at neap tide), due to the fortnightly tidal
modulation.
These theoretical results were revisited and confirmed
with the introduction of alternative parameters by Fisher
(1972), Prandle (1985), Jay and Smith (1988), and Scott
(1993). In Prandle’s paper, the nondimensional p c axis
was replaced by the ratio of the residual accelerations
low salinity
high salinity
U R
B
A
−U E
U E
Estuarine Circulation, Figure 1 Schematic longitudinal section of an estuary showing the influence of advection ()due to river
discharge U R and tidal currents) and vertical mixing (thin waving lines) in the local salt balance. The thick lines are isohalines. Box
A (upper layer), horizontal advection causes a reduction of salinity, but vertical mixing compensates by replacing the low-salinity
water with underlying high-salinity water. The relative roles of advection and mixing are reversed in Box B (lower layer). Bidirectional
circulation is shown in the vertical profile of the u-velocity component (dashed line) with the depth of no motion, and U E and ÀU E are
upper and lower maxima values shown in this profile. According to Geyer (2010).
Estuarine Circulation, Figure 2 Stratification-circulation
diagram with experimental data of the Caravelas River Estuary
(southern Bahia State, Brazil) for the August (spring and neap
tide) and for January (spring tide) experiments. The values of the
parameter u are indicated close to the symbols + and o. The
circulation parameter (u s /u f ) was approximate to u s /u a , were u a
is the residual velocity (time mean-depth value).
ESTUARINE CIRCULATION
249
turbulent diffusion and the advection, respectively. When
f D >> f A , it follows that u ! 1 and the salt flux are
dominated by the tidal mixing; for f D << f A , u ! 0 and
the salt flux is dominated by advection (gravitational
circulation). Then, this parameter varies from 0 to 1, and
u ¼ u(p c , p e ) is expressed theoretically by Miranda
et al. (2012):
p e
ð Þ
À1 210 þ 252 p c À 1:5
ð
Þ
½
u
2
þ 32 À p e
ð Þ
À1 210 þ 252 p c À 1:5
ð
Þ
ð
Þ
h
þ 76 p c À 1:5
ð
Þ
þ
152
3
p c À 1:5
ð
Þ
2
i
u ¼ 0;
ð1Þ
For u ¼ 0 (1) has no physical meaning, and for u ¼ 1 the
salt transport is due to the turbulent diffusion only.
The equation is thus reduced to:
32 þ 76 p c À 1:5
ð
Þþ
152
3
p c À 1:5
ð
Þ
2 ¼ 0
ð2Þ
This equation with the unknown (p c À1.5) has no solution
in the field, unless the constant 32 is disregarded. If so, it
has two solutions: p c ¼ 0 (with no physical meaning)
and p c ¼ 1.5, which indicates that when the salt flux is
due to the turbulent diffusion (u ¼ 1), its solution is independent of the stratification parameter (p e ). Under this
simplification, it is possible (1) to define a set of isolines
in a Cartesian Coordinate system (p e  p c ) with u ¼ cte
and interval 0 < u 1.
Hansen and Rattray (1966) confirmed that theory by
analyzing an experimental data set from several estuaries,
from which four previously classified estuarine types
emerged: (1) Type 1, well-mixed estuary (unidirectional
circulation); (2) Type 2, partially mixed estuary
(circulation reverses at depth); (3) Type 3, fjords; and
(4) Type 4, salt-wedge estuary. Types 3 and 4 were classified because their experimental data fits very well in the
stratification-circulation diagram. Subdivisions a and
b for Types 1, 2, and 3 are low and high stratification when
p e < 0.1 and p e > 0.1, respectively.
Figure 2 shows application of this diagram, with observational data for the tropical Caravelas River Estuary,
located in the SE Brazilian coast (lat. 17
45
0 14.0
00 ; long.
039
13
0 53,0W
00 ). The classification changes from well
mixed (u % 1.00 – all salt transport is due to diffusion in
the spring tide) to partially mixed with low stratification
(u ¼ 0.80, meaning that 80 % and 20 % are the
up-estuary salt transport due to diffusion and advection,
respectively, at neap tide), due to the fortnightly tidal
modulation.
These theoretical results were revisited and confirmed
with the introduction of alternative parameters by Fisher
(1972), Prandle (1985), Jay and Smith (1988), and Scott
(1993). In Prandle’s paper, the nondimensional p c axis
was replaced by the ratio of the residual accelerations
low salinity
high salinity
U R
B
A
−U E
U E
Estuarine Circulation, Figure 1 Schematic longitudinal section of an estuary showing the influence of advection ()due to river
discharge U R and tidal currents) and vertical mixing (thin waving lines) in the local salt balance. The thick lines are isohalines. Box
A (upper layer), horizontal advection causes a reduction of salinity, but vertical mixing compensates by replacing the low-salinity
water with underlying high-salinity water. The relative roles of advection and mixing are reversed in Box B (lower layer). Bidirectional
circulation is shown in the vertical profile of the u-velocity component (dashed line) with the depth of no motion, and U E and ÀU E are
upper and lower maxima values shown in this profile. According to Geyer (2010).
Estuarine Circulation, Figure 2 Stratification-circulation
diagram with experimental data of the Caravelas River Estuary
(southern Bahia State, Brazil) for the August (spring and neap
tide) and for January (spring tide) experiments. The values of the
parameter u are indicated close to the symbols + and o. The
circulation parameter (u s /u f ) was approximate to u s /u a , were u a
is the residual velocity (time mean-depth value).
ESTUARINE CIRCULATION
249