

9
8
7
6 I"-"-"'-'-J...OIII~u.....u.
18
~ ~--~~--~----~+---~~--~~-4~--~~--~~--~~~
5
3
1
80 ~--~~--~-----+-----+~--~~--~----~~--4-~--~~~
60
40
20 r----{
'10000
4000
2000
1000
400
200
100 t---~~----~----~--~~~-4~~-+~---+~--~~--~----~
60
50
40
30
2O~~~~~~~~~~~~~~~~~~~'+'~~TE~~~~~~
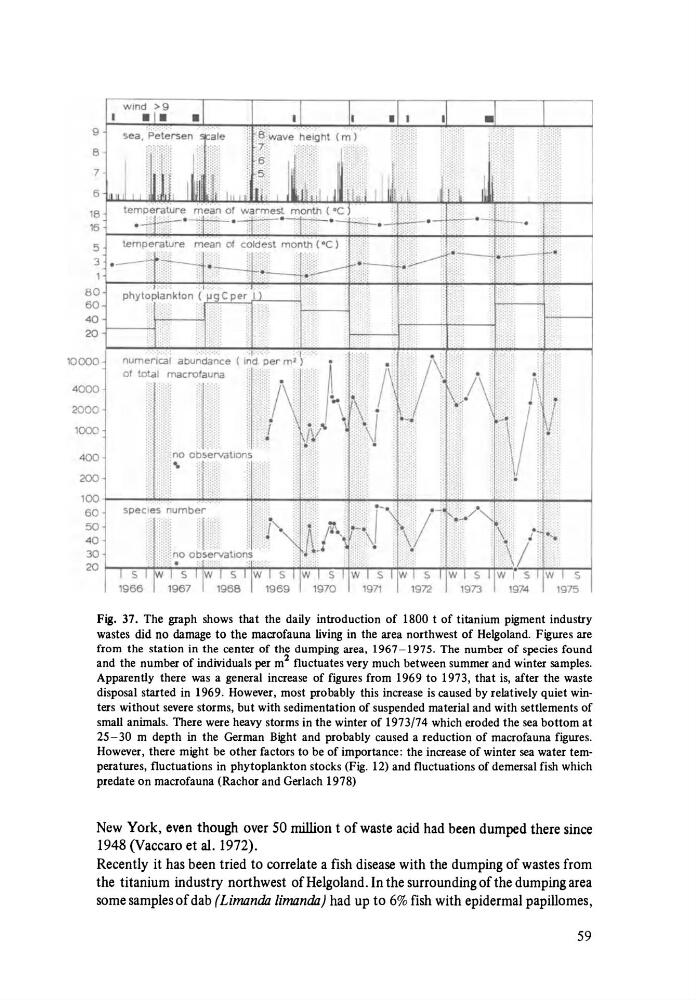
Fig. 37. The graph shows that the daily introduction of 1800 t of titanium pigment industry
wastes did no damage to the macrofauna living in the area northwest of Helgoland. Figures are
from the station in the center of the dumping area, 1967-1975. The number of species found
and the number of individuals per m 2 fluctuates very much between summer and winter samples.
Apparently there was a general increase of figures from 1969 to 1973, that is, after the waste
disposal started in 1969. However, most probably this increase is caused by relatively quiet winters without severe storms, but with sedimentation of suspended material and with settlements of
small animals. There were heavy storms in the winter of 1973/74 which eroded the sea bottom at
25-30 m depth in the German Bight and probably caused a reduction of macrofauna figures.
However, there might be other factors to be of importance: the increase of winter sea water temperatures, fluctuations in phytoplankton stocks (Fig. 12) and fluctuations of demersal fish which
predate on macrofauna (Rachor and Gerlach 1978)
New York, even though over 50 million t of waste acid had been dumped there since
1948 (Vaccaro et aI. 1972).
Recently it has been tried to correlate a fish disease with the dumping of wastes from
the titanium industry northwest of Helgoland. In the surrounding of the dumping area
some samples of dab (Limandil limandil) had up to 6% fish with epidermal papillomes,
59
8
7
6 I"-"-"'-'-J...OIII~u.....u.
18
~ ~--~~--~----~+---~~--~~-4~--~~--~~--~~~
5
3
1
80 ~--~~--~-----+-----+~--~~--~----~~--4-~--~~~
60
40
20 r----{
'10000
4000
2000
1000
400
200
100 t---~~----~----~--~~~-4~~-+~---+~--~~--~----~
60
50
40
30
2O~~~~~~~~~~~~~~~~~~~'+'~~TE~~~~~~
Fig. 37. The graph shows that the daily introduction of 1800 t of titanium pigment industry
wastes did no damage to the macrofauna living in the area northwest of Helgoland. Figures are
from the station in the center of the dumping area, 1967-1975. The number of species found
and the number of individuals per m 2 fluctuates very much between summer and winter samples.
Apparently there was a general increase of figures from 1969 to 1973, that is, after the waste
disposal started in 1969. However, most probably this increase is caused by relatively quiet winters without severe storms, but with sedimentation of suspended material and with settlements of
small animals. There were heavy storms in the winter of 1973/74 which eroded the sea bottom at
25-30 m depth in the German Bight and probably caused a reduction of macrofauna figures.
However, there might be other factors to be of importance: the increase of winter sea water temperatures, fluctuations in phytoplankton stocks (Fig. 12) and fluctuations of demersal fish which
predate on macrofauna (Rachor and Gerlach 1978)
New York, even though over 50 million t of waste acid had been dumped there since
1948 (Vaccaro et aI. 1972).
Recently it has been tried to correlate a fish disease with the dumping of wastes from
the titanium industry northwest of Helgoland. In the surrounding of the dumping area
some samples of dab (Limandil limandil) had up to 6% fish with epidermal papillomes,
59