

mg/kg
3.5
3.0
-DOE
.. ········001
./ •
•
2.5
.----000
•
•
2.0
;.
1.5
I.
./ . .
_.!/. .... Il .......... ~ ................ ":.
. . . 0'
L.e
••
\
."
..
" .
...... /
-\
0.5 f~·
· \,.
.
..
. . . .
.. 6.
Ii
•
.. ---.--.---~--.-----...
-~,/-~ .. -- . .. ""
0.0 J'£. , , ! I I , , , I ' , I , I ' , I , I ' , ,
1950
1955
1960
1965
1970
1.0
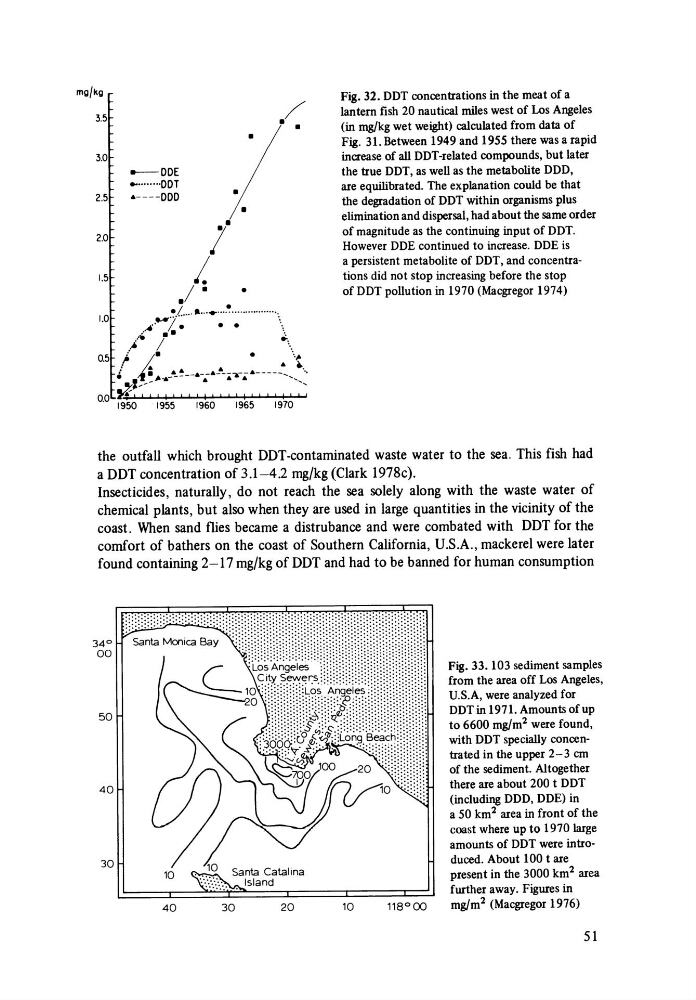
Fig. 32. DDT concentrations in the meat of a
lantern fish 20 nautical miles west of Los Angeles
(in mg/kg wet weight) calculated from data of
Fig. 31. Between 1949 and 1955 there was a rapid
increase of all DDT-related compounds, but later
the true DDT, as well as the metabolite DOD,
are equilibrated. The explanation could be that
the degradation of DDT within organisms plus
elimination and dispersal, had about the same order
of magnitude as the continuing input of DDT.
However DOE continued to increase. DOE is
a persistent metabolite of DDT, and concentrations did not stop increasing before the stop
of DDT pollution in 1970 (Macgregor 1974)
the outfall which brought DDT-contaminated waste water to the sea. This fish had
a DDT concentration of 3.1-4.2 mg/kg (Clark 1978c).
Insecticides, naturally, do not reach the sea solely along with the waste water of
chemical plants, but also when they are used in large quantities in the vicinity of the
coast. When sand flies became a distrubance and were combated with DDT for the
comfort of bathers on the coast of Southern California, U.S.A., mackerel were later
found containing 2-17 mg/kg of DDT and had to be banned for human consumption
Fig. 33. 103 sediment samples
from the area off Los Angeles,
U.S.A, were analyzed for
DDT in 1971. Amounts of up
to 6600 mg/m 2 were found,
with DDT specially concentrated in the upper 2-3 em
of the sediment. Altogether
there are about 200 tOOT
(including DOD, DOE) in
a 50 km 2 area in front of the
coast where up to 1970 large
amounts of DDT were introduced. About 100 t are
present in the 3000 km 2 area
further away. Figures in
mg/m 2 (Macgregor 1976)
51
3.5
3.0
-DOE
.. ········001
./ •
•
2.5
.----000
•
•
2.0
;.
1.5
I.
./ . .
_.!/. .... Il .......... ~ ................ ":.
. . . 0'
L.e
••
\
."
..
" .
...... /
-\
0.5 f~·
· \,.
.
..
. . . .
.. 6.
Ii
•
.. ---.--.---~--.-----...
-~,/-~ .. -- . .. ""
0.0 J'£. , , ! I I , , , I ' , I , I ' , I , I ' , ,
1950
1955
1960
1965
1970
1.0
Fig. 32. DDT concentrations in the meat of a
lantern fish 20 nautical miles west of Los Angeles
(in mg/kg wet weight) calculated from data of
Fig. 31. Between 1949 and 1955 there was a rapid
increase of all DDT-related compounds, but later
the true DDT, as well as the metabolite DOD,
are equilibrated. The explanation could be that
the degradation of DDT within organisms plus
elimination and dispersal, had about the same order
of magnitude as the continuing input of DDT.
However DOE continued to increase. DOE is
a persistent metabolite of DDT, and concentrations did not stop increasing before the stop
of DDT pollution in 1970 (Macgregor 1974)
the outfall which brought DDT-contaminated waste water to the sea. This fish had
a DDT concentration of 3.1-4.2 mg/kg (Clark 1978c).
Insecticides, naturally, do not reach the sea solely along with the waste water of
chemical plants, but also when they are used in large quantities in the vicinity of the
coast. When sand flies became a distrubance and were combated with DDT for the
comfort of bathers on the coast of Southern California, U.S.A., mackerel were later
found containing 2-17 mg/kg of DDT and had to be banned for human consumption
Fig. 33. 103 sediment samples
from the area off Los Angeles,
U.S.A, were analyzed for
DDT in 1971. Amounts of up
to 6600 mg/m 2 were found,
with DDT specially concentrated in the upper 2-3 em
of the sediment. Altogether
there are about 200 tOOT
(including DOD, DOE) in
a 50 km 2 area in front of the
coast where up to 1970 large
amounts of DDT were introduced. About 100 t are
present in the 3000 km 2 area
further away. Figures in
mg/m 2 (Macgregor 1976)
51