

Vl
-..l
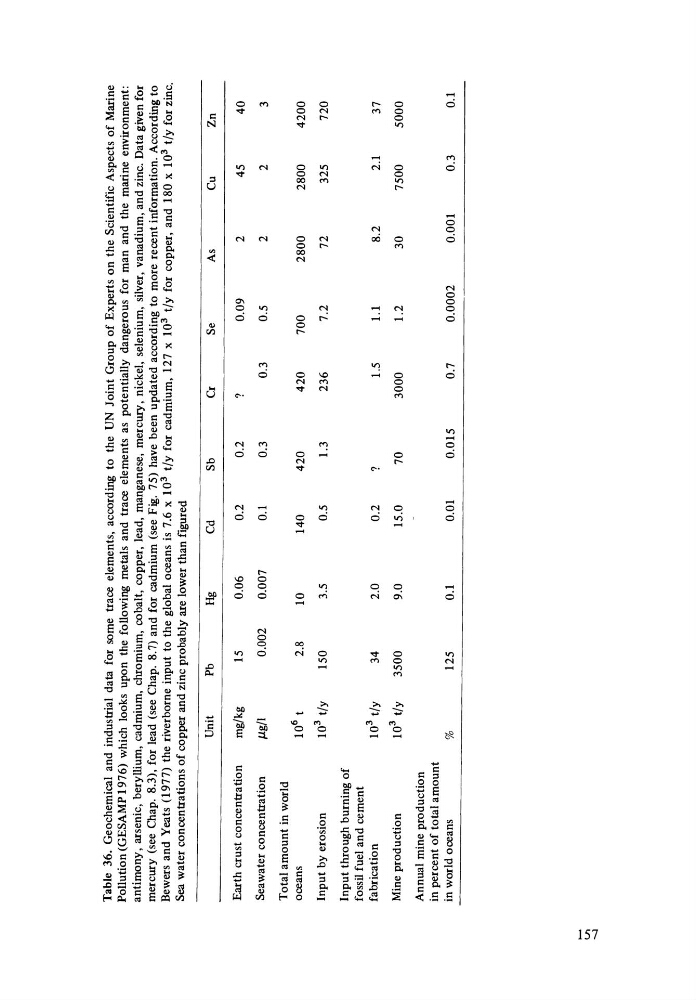
Table 36. Geochemical and industrial data for some trace elements, according to the UN Joint Group of Experts on the Scientific Aspects of Marine
Pollution (GESAMP 1976) which looks upon the following metals and trace elements as potentially dangerous for
man and the marine environment:
antimony, arsenic, beryllium, cadmium, chromium, cobalt, copper, lead, manganese, mercury, nickel, selenium, silver, vanadium, and zinc. Data given for
mercury (see Chap. 8.3), for lead (see Chap. 8.7) and for cadmium (see Fig. 75) have been updated according to more recent information. According to
Bewers and Yeats (1977) the riverborne input to the global oceans is 7.6 x 10 3
t/y for cadmium, 127 x 10 3
t/y for copper, and 180 x 10 3
t/y for zinc.
Sea water concentrations of copper and zinc probably are lower than figured
Unit
Pb
Hg
Cd
Sb
Cr
Se
As
Cu
Zn
Earth crust concentration
mg/kg
15
0.06
0.2
0.2
?
0.09
2
45
40
Seawater concentration
P.g/l
0.002
0.007
0.1
0.3
0.3
0.5
2
2
3
Total amount in world
oceans
10 6
t
2.8
10
140
420
420
700
2800
2800
4200
Input by erosion
10 3
t/y
150
3.5
0.5
1.3
236
7.2
72
325
720
Input through burning of
fossil fuel and cement
fabrication
10 3
t/y
34
2.0
0.2
?
1.5
1.1
8.2
2.1
37
Mine production
10 3
t/y
3500
9.0
15.0
70
3000
1.2
30
7500
5000
Annual mine production
in percent of total amount
in world oceans
%
125
0.1
0.01
0.015
0.7
0.0002
0.001
0.3
0.1
-..l
Table 36. Geochemical and industrial data for some trace elements, according to the UN Joint Group of Experts on the Scientific Aspects of Marine
Pollution (GESAMP 1976) which looks upon the following metals and trace elements as potentially dangerous for
man and the marine environment:
antimony, arsenic, beryllium, cadmium, chromium, cobalt, copper, lead, manganese, mercury, nickel, selenium, silver, vanadium, and zinc. Data given for
mercury (see Chap. 8.3), for lead (see Chap. 8.7) and for cadmium (see Fig. 75) have been updated according to more recent information. According to
Bewers and Yeats (1977) the riverborne input to the global oceans is 7.6 x 10 3
t/y for cadmium, 127 x 10 3
t/y for copper, and 180 x 10 3
t/y for zinc.
Sea water concentrations of copper and zinc probably are lower than figured
Unit
Pb
Hg
Cd
Sb
Cr
Se
As
Cu
Zn
Earth crust concentration
mg/kg
15
0.06
0.2
0.2
?
0.09
2
45
40
Seawater concentration
P.g/l
0.002
0.007
0.1
0.3
0.3
0.5
2
2
3
Total amount in world
oceans
10 6
t
2.8
10
140
420
420
700
2800
2800
4200
Input by erosion
10 3
t/y
150
3.5
0.5
1.3
236
7.2
72
325
720
Input through burning of
fossil fuel and cement
fabrication
10 3
t/y
34
2.0
0.2
?
1.5
1.1
8.2
2.1
37
Mine production
10 3
t/y
3500
9.0
15.0
70
3000
1.2
30
7500
5000
Annual mine production
in percent of total amount
in world oceans
%
125
0.1
0.01
0.015
0.7
0.0002
0.001
0.3
0.1