

322
Gerhard von der Emde
quantitatively and independently from one another (von der Emde 1990; von der
Emde and Ringer 1992).
The ability to detect capacitive object properties through active electrolocation
was termed capacitance detection. In analogy to color vision, capacitive objects
are perceived as having an electrical color. Capacitance detection thus colors the
electrical shadow that is projected onto the fish's skin, according to Lissmann
(1958). The sensory images an electric fish gathers from its surroundings at night
are not like black-and-white pictures but they contain much more information
about object properties than originally thought. Imagine, for example, a G. petersii
hunting for insect larvae on the ground of a river at night. Small living prey items
have electrical color, while the resistive background appears gray. As a consequence, prey stands out much more clearly and can be detected more easily by
electrolocating fish (von der Emde and Bleckrnann 1998).
100 .................................. _..........
~--:;:.:··~ .. - ·.
~ 90 ~:,._~,.-"' 80
-~
a : . . . . . . . . . . . . . . .. . . . . . . . . . . . . . . . . . . . . . . . . . . . . ~-~'J1f~ -~-~ · -· ·
s
~~I
0
~ >o
- - G. pelersii I
--~·- G. pelersii2
~
U 40
.......... G. pelersii 3
~
30
0, 1
10
100
1000
Resistance [kn)
. - - -- - - - - - , Eig.3 Eig.2 Eig. l
0,1
- • - Eigenmannia I
··• ·· Eigenmannia 2
···• ··· Eigenmannia 3
10
100
Resistance [ill)
1000
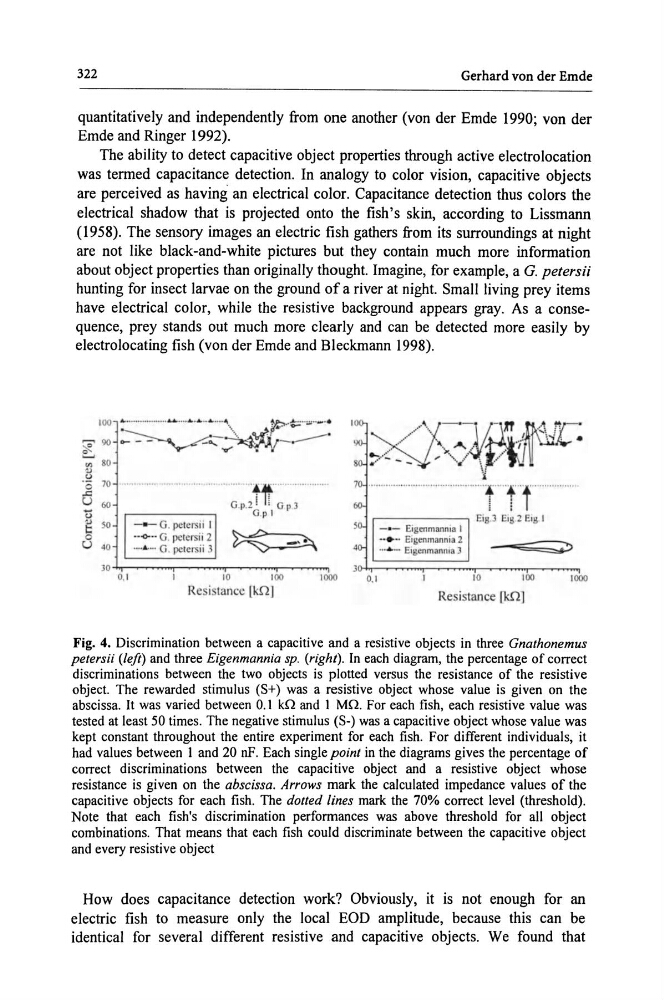
Fig. 4. Discrimination between a capacitive and a resistive objects in three Gnathonemus
p etersii (left) and three Eigenmannia sp. (right). In each diagram, the percentage of correct
discriminations between the two objects is plotted versus the resistance of the resistive
object. The rewarded stimulus (S+) was a resistive object whose value is given on the
abscissa. It was varied between 0.1 kn and I Mn. For each fish, each resistive value was
tested at least 50 times. The negative stimulus (S·) was a capacitive object whose value was
kept constant throughout the entire experiment for each fish. For different individuals, it
had values between 1 and 20 nF. Each single point in the diagrams gives the percentage of
correct discriminations between the capacitive object and a resistive object whose
resistance is given on the abscissa. Arrows mark the calculated impedance values of the
capacitive objects for each fish. The dotted lines mark the 70% correct level (threshold).
Note that each fish's discrimination performances was above threshold for all object
combinations. That means that each fish could discriminate between the capacitive object
and every resistive object
How does capacitance detection work? Obviously, it is not enough for an
electric fish to measure only the local EOD amplitude, because this can be
identical for several different resistive and capacitive objects. We found that
Gerhard von der Emde
quantitatively and independently from one another (von der Emde 1990; von der
Emde and Ringer 1992).
The ability to detect capacitive object properties through active electrolocation
was termed capacitance detection. In analogy to color vision, capacitive objects
are perceived as having an electrical color. Capacitance detection thus colors the
electrical shadow that is projected onto the fish's skin, according to Lissmann
(1958). The sensory images an electric fish gathers from its surroundings at night
are not like black-and-white pictures but they contain much more information
about object properties than originally thought. Imagine, for example, a G. petersii
hunting for insect larvae on the ground of a river at night. Small living prey items
have electrical color, while the resistive background appears gray. As a consequence, prey stands out much more clearly and can be detected more easily by
electrolocating fish (von der Emde and Bleckrnann 1998).
100 .................................. _..........
~--:;:.:··~ .. - ·.
~ 90 ~:,._~,.-"' 80
-~
a : . . . . . . . . . . . . . . .. . . . . . . . . . . . . . . . . . . . . . . . . . . . . ~-~'J1f~ -~-~ · -· ·
s
~~I
0
~ >o
- - G. pelersii I
--~·- G. pelersii2
~
U 40
.......... G. pelersii 3
~
30
0, 1
10
100
1000
Resistance [kn)
. - - -- - - - - - , Eig.3 Eig.2 Eig. l
0,1
- • - Eigenmannia I
··• ·· Eigenmannia 2
···• ··· Eigenmannia 3
10
100
Resistance [ill)
1000
Fig. 4. Discrimination between a capacitive and a resistive objects in three Gnathonemus
p etersii (left) and three Eigenmannia sp. (right). In each diagram, the percentage of correct
discriminations between the two objects is plotted versus the resistance of the resistive
object. The rewarded stimulus (S+) was a resistive object whose value is given on the
abscissa. It was varied between 0.1 kn and I Mn. For each fish, each resistive value was
tested at least 50 times. The negative stimulus (S·) was a capacitive object whose value was
kept constant throughout the entire experiment for each fish. For different individuals, it
had values between 1 and 20 nF. Each single point in the diagrams gives the percentage of
correct discriminations between the capacitive object and a resistive object whose
resistance is given on the abscissa. Arrows mark the calculated impedance values of the
capacitive objects for each fish. The dotted lines mark the 70% correct level (threshold).
Note that each fish's discrimination performances was above threshold for all object
combinations. That means that each fish could discriminate between the capacitive object
and every resistive object
How does capacitance detection work? Obviously, it is not enough for an
electric fish to measure only the local EOD amplitude, because this can be
identical for several different resistive and capacitive objects. We found that