

Bioprocess Engineering of Phototrophic Marine Organisms 9.4 Limiting Factors in Photobioreactor Design and Operation 285
Part B | 9.4
0:8 for seawater. It should be noted here that (9.49)
should be used at pH 7:5 and higher, as speciation of
CO 2 provides a chemical reaction within the liquid film
that is described by penetration theory.
Values of k L a for O 2 transfer in various bioreactor configurations are determined by well-established
correlations or by direct measurements within the bioreactor. For example, a simple but very approximate k L a
correlation for O 2 transfer in a bubble-column bioreactor presented by Chisti and Moo-Young [9.41] is
k L a D 0:76 u gs
0:8
;
(9.50)
where k L a has units of s
1 and u gs is the superficial
gas velocity in units of m s
1 , defined as the volumetric flow rate of the entering aeration gas divided
by the cross-sectional area of the bioreactor vessel.
Well-established experimental methods also exist for
estimating k L a directly in the photobioreactor culture
by measurement of the dissolved oxygen versus time
profile induced by a step change in aeration gas composition. A detailed presentation of the many correlations
available to measure or estimate k L a for a particular
bioreactor configuration and aeration system is beyond
the scope of this chapter, but representative approaches
are provided in [9.41–44].
Models for CO 2 -Limited Growth
Carbon dioxide-limited growth occurs if C x is greater
than C x;c ((9.47)). Under CO 2 -limited growth, the volumetric biomass production rate C x is set by (9.46).
Therefore, if C x > C x;c then biomass production for
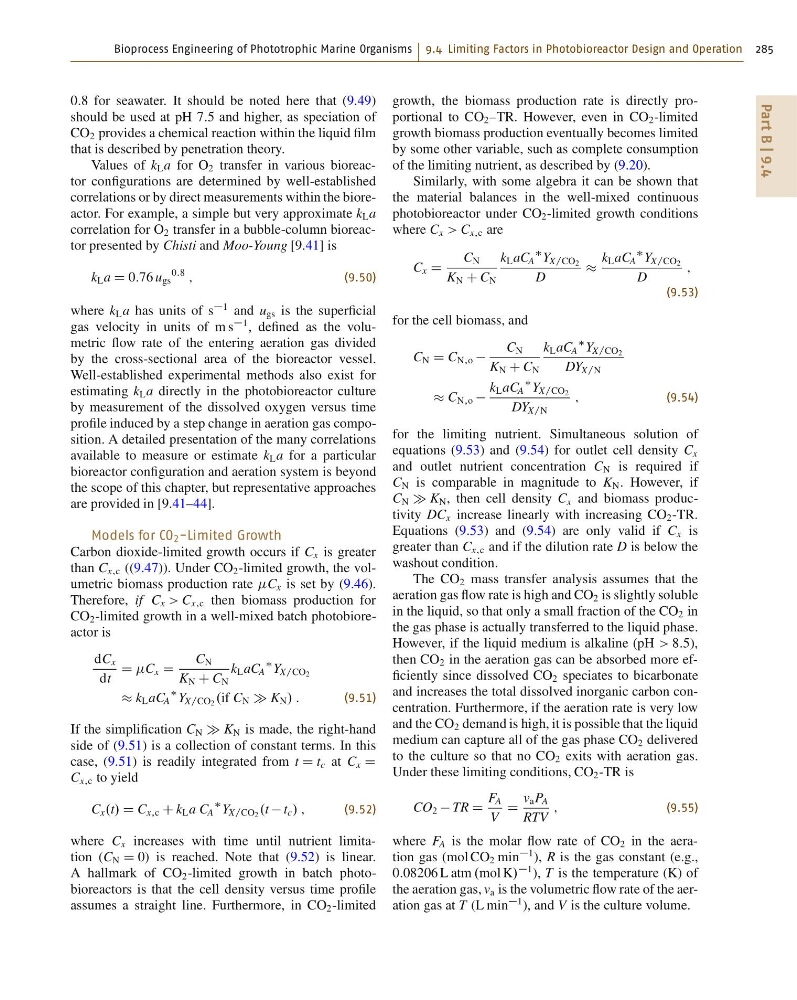
CO 2 -limited growth in a well-mixed batch photobioreactor is
dC x
dt
D C x D
C N
K N C C N
k L aC A
Y X=CO2
k L aC A
Y X=CO2 .if C N K N / :
(9.51)
If the simplification C N K N is made, the right-hand
side of (9.51) is a collection of constant terms. In this
case, (9.51) is readily integrated from t D t c at C x D
C x;c to yield
C x .t/ D C x;c C k L a C A
Y X=CO2 .t t c / ;
(9.52)
where C x increases with time until nutrient limitation (C N D 0) is reached. Note that (9.52) is linear.
A hallmark of CO 2 -limited growth in batch photobioreactors is that the cell density versus time profile
assumes a straight line. Furthermore, in CO 2 -limited
growth, the biomass production rate is directly proportional to CO 2 –TR. However, even in CO 2 -limited
growth biomass production eventually becomes limited
by some other variable, such as complete consumption
of the limiting nutrient, as described by (9.20).
Similarly, with some algebra it can be shown that
the material balances in the well-mixed continuous
photobioreactor under CO 2 -limited growth conditions
where C x > C x;c are
C x D
C N
K N C C N
k L aC A
Y X=CO2
D
k L aC A
Y X=CO2
D
;
(9.53)
for the cell biomass, and
C N D C N;o
C N
K N C C N
k L aC A
Y X=CO2
DY X=N
C N;o
k L aC A
Y X=CO2
DY X=N
;
(9.54)
for the limiting nutrient. Simultaneous solution of
equations (9.53) and (9.54) for outlet cell density C x
and outlet nutrient concentration C N is required if
C N is comparable in magnitude to K N . However, if
C N K N , then cell density C x and biomass productivity DC x increase linearly with increasing CO 2 -TR.
Equations (9.53) and (9.54) are only valid if C x is
greater than C x;c and if the dilution rate D is below the
washout condition.
The CO 2 mass transfer analysis assumes that the
aeration gas flow rate is high and CO 2 is slightly soluble
in the liquid, so that only a small fraction of the CO 2 in
the gas phase is actually transferred to the liquid phase.
However, if the liquid medium is alkaline (pH > 8:5),
then CO 2 in the aeration gas can be absorbed more efficiently since dissolved CO 2 speciates to bicarbonate
and increases the total dissolved inorganic carbon concentration. Furthermore, if the aeration rate is very low
and the CO 2 demand is high, it is possible that the liquid
medium can capture all of the gas phase CO 2 delivered
to the culture so that no CO 2 exits with aeration gas.
Under these limiting conditions, CO 2 -TR is
CO 2 TR D
F A
V
D
v a P A
RTV
;
(9.55)
where F A is the molar flow rate of CO 2 in the aeration gas (mol CO 2 min
1 ), R is the gas constant (e.g.,
0:08206 L atm .mol K/
1 ), T is the temperature (K) of
the aeration gas, v a is the volumetric flow rate of the aeration gas at T (L min
1 ), and V is the culture volume.
Part B | 9.4
0:8 for seawater. It should be noted here that (9.49)
should be used at pH 7:5 and higher, as speciation of
CO 2 provides a chemical reaction within the liquid film
that is described by penetration theory.
Values of k L a for O 2 transfer in various bioreactor configurations are determined by well-established
correlations or by direct measurements within the bioreactor. For example, a simple but very approximate k L a
correlation for O 2 transfer in a bubble-column bioreactor presented by Chisti and Moo-Young [9.41] is
k L a D 0:76 u gs
0:8
;
(9.50)
where k L a has units of s
1 and u gs is the superficial
gas velocity in units of m s
1 , defined as the volumetric flow rate of the entering aeration gas divided
by the cross-sectional area of the bioreactor vessel.
Well-established experimental methods also exist for
estimating k L a directly in the photobioreactor culture
by measurement of the dissolved oxygen versus time
profile induced by a step change in aeration gas composition. A detailed presentation of the many correlations
available to measure or estimate k L a for a particular
bioreactor configuration and aeration system is beyond
the scope of this chapter, but representative approaches
are provided in [9.41–44].
Models for CO 2 -Limited Growth
Carbon dioxide-limited growth occurs if C x is greater
than C x;c ((9.47)). Under CO 2 -limited growth, the volumetric biomass production rate C x is set by (9.46).
Therefore, if C x > C x;c then biomass production for
CO 2 -limited growth in a well-mixed batch photobioreactor is
dC x
dt
D C x D
C N
K N C C N
k L aC A
Y X=CO2
k L aC A
Y X=CO2 .if C N K N / :
(9.51)
If the simplification C N K N is made, the right-hand
side of (9.51) is a collection of constant terms. In this
case, (9.51) is readily integrated from t D t c at C x D
C x;c to yield
C x .t/ D C x;c C k L a C A
Y X=CO2 .t t c / ;
(9.52)
where C x increases with time until nutrient limitation (C N D 0) is reached. Note that (9.52) is linear.
A hallmark of CO 2 -limited growth in batch photobioreactors is that the cell density versus time profile
assumes a straight line. Furthermore, in CO 2 -limited
growth, the biomass production rate is directly proportional to CO 2 –TR. However, even in CO 2 -limited
growth biomass production eventually becomes limited
by some other variable, such as complete consumption
of the limiting nutrient, as described by (9.20).
Similarly, with some algebra it can be shown that
the material balances in the well-mixed continuous
photobioreactor under CO 2 -limited growth conditions
where C x > C x;c are
C x D
C N
K N C C N
k L aC A
Y X=CO2
D
k L aC A
Y X=CO2
D
;
(9.53)
for the cell biomass, and
C N D C N;o
C N
K N C C N
k L aC A
Y X=CO2
DY X=N
C N;o
k L aC A
Y X=CO2
DY X=N
;
(9.54)
for the limiting nutrient. Simultaneous solution of
equations (9.53) and (9.54) for outlet cell density C x
and outlet nutrient concentration C N is required if
C N is comparable in magnitude to K N . However, if
C N K N , then cell density C x and biomass productivity DC x increase linearly with increasing CO 2 -TR.
Equations (9.53) and (9.54) are only valid if C x is
greater than C x;c and if the dilution rate D is below the
washout condition.
The CO 2 mass transfer analysis assumes that the
aeration gas flow rate is high and CO 2 is slightly soluble
in the liquid, so that only a small fraction of the CO 2 in
the gas phase is actually transferred to the liquid phase.
However, if the liquid medium is alkaline (pH > 8:5),
then CO 2 in the aeration gas can be absorbed more efficiently since dissolved CO 2 speciates to bicarbonate
and increases the total dissolved inorganic carbon concentration. Furthermore, if the aeration rate is very low
and the CO 2 demand is high, it is possible that the liquid
medium can capture all of the gas phase CO 2 delivered
to the culture so that no CO 2 exits with aeration gas.
Under these limiting conditions, CO 2 -TR is
CO 2 TR D
F A
V
D
v a P A
RTV
;
(9.55)
where F A is the molar flow rate of CO 2 in the aeration gas (mol CO 2 min
1 ), R is the gas constant (e.g.,
0:08206 L atm .mol K/
1 ), T is the temperature (K) of
the aeration gas, v a is the volumetric flow rate of the aeration gas at T (L min
1 ), and V is the culture volume.