

Part B | 9.4
278 Part B Tools and Methods in Marine Biotechnology
I 0
/
I 0
I (z)
l w
L
z
Light source
intensity
Transparent
vessel wall
Liquid suspension culture
a)
Macroscopic View
Scattering
by cell
Absorption by
chlorophyll
Irradiance
incident to
cell (I)
Transmitted irradiance
b)
Microscopic View
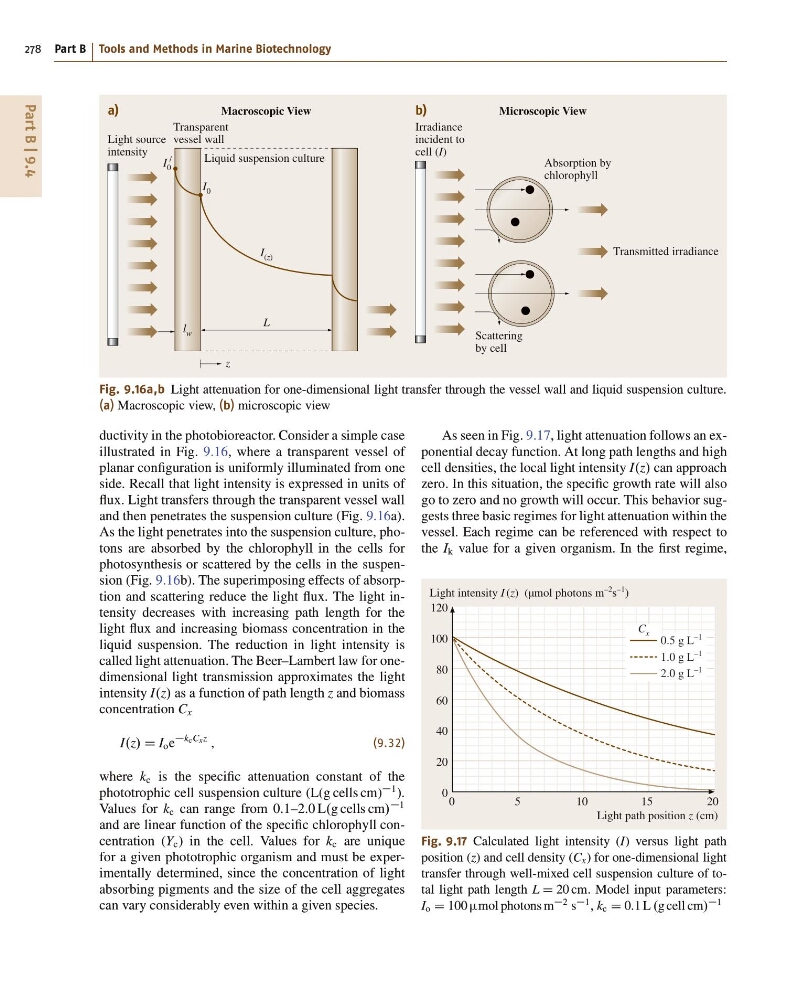
Fig. 9.16a,b Light attenuation for one-dimensional light transfer through the vessel wall and liquid suspension culture.
(a) Macroscopic view, (b) microscopic view
ductivity in the photobioreactor. Consider a simple case
illustrated in Fig. 9.16, where a transparent vessel of
planar configuration is uniformly illuminated from one
side. Recall that light intensity is expressed in units of
flux. Light transfers through the transparent vessel wall
and then penetrates the suspension culture (Fig. 9.16a).
As the light penetrates into the suspension culture, photons are absorbed by the chlorophyll in the cells for
photosynthesis or scattered by the cells in the suspension (Fig. 9.16b). The superimposing effects of absorption and scattering reduce the light flux. The light intensity decreases with increasing path length for the
light flux and increasing biomass concentration in the
liquid suspension. The reduction in light intensity is
called light attenuation. The Beer–Lambert law for onedimensional light transmission approximates the light
intensity I.z/ as a function of path length z and biomass
concentration C x
I.z/ D I o e
kcCxz
;
(9.32)
where k c is the specific attenuation constant of the
phototrophic cell suspension culture (L(g cells cm)
1 ).
Values for k c can range from 0:1–2:0 L.g cells cm/
1
and are linear function of the specific chlorophyll concentration (Y c ) in the cell. Values for k c are unique
for a given phototrophic organism and must be experimentally determined, since the concentration of light
absorbing pigments and the size of the cell aggregates
can vary considerably even within a given species.
As seen in Fig. 9.17, light attenuation follows an exponential decay function. At long path lengths and high
cell densities, the local light intensity I.z/ can approach
zero. In this situation, the specific growth rate will also
go to zero and no growth will occur. This behavior suggests three basic regimes for light attenuation within the
vessel. Each regime can be referenced with respect to
the I k value for a given organism. In the first regime,
0
20
40
60
80
100
120
0
5
10
15
20
Light path position z (cm)
Light intensity I (z) (µmol photons m
–2 s
–1 )
0.5 g L
–1
1.0 g L
–1
2.0 g L
–1
C x
Fig. 9.17 Calculated light intensity (I) versus light path
position (z) and cell density (C x ) for one-dimensional light
transfer through well-mixed cell suspension culture of total light path length L D 20 cm. Model input parameters:
I o D 100 mol photons m
2 s
1 , k c D 0:1 L .g cell cm/
1
278 Part B Tools and Methods in Marine Biotechnology
I 0
/
I 0
I (z)
l w
L
z
Light source
intensity
Transparent
vessel wall
Liquid suspension culture
a)
Macroscopic View
Scattering
by cell
Absorption by
chlorophyll
Irradiance
incident to
cell (I)
Transmitted irradiance
b)
Microscopic View
Fig. 9.16a,b Light attenuation for one-dimensional light transfer through the vessel wall and liquid suspension culture.
(a) Macroscopic view, (b) microscopic view
ductivity in the photobioreactor. Consider a simple case
illustrated in Fig. 9.16, where a transparent vessel of
planar configuration is uniformly illuminated from one
side. Recall that light intensity is expressed in units of
flux. Light transfers through the transparent vessel wall
and then penetrates the suspension culture (Fig. 9.16a).
As the light penetrates into the suspension culture, photons are absorbed by the chlorophyll in the cells for
photosynthesis or scattered by the cells in the suspension (Fig. 9.16b). The superimposing effects of absorption and scattering reduce the light flux. The light intensity decreases with increasing path length for the
light flux and increasing biomass concentration in the
liquid suspension. The reduction in light intensity is
called light attenuation. The Beer–Lambert law for onedimensional light transmission approximates the light
intensity I.z/ as a function of path length z and biomass
concentration C x
I.z/ D I o e
kcCxz
;
(9.32)
where k c is the specific attenuation constant of the
phototrophic cell suspension culture (L(g cells cm)
1 ).
Values for k c can range from 0:1–2:0 L.g cells cm/
1
and are linear function of the specific chlorophyll concentration (Y c ) in the cell. Values for k c are unique
for a given phototrophic organism and must be experimentally determined, since the concentration of light
absorbing pigments and the size of the cell aggregates
can vary considerably even within a given species.
As seen in Fig. 9.17, light attenuation follows an exponential decay function. At long path lengths and high
cell densities, the local light intensity I.z/ can approach
zero. In this situation, the specific growth rate will also
go to zero and no growth will occur. This behavior suggests three basic regimes for light attenuation within the
vessel. Each regime can be referenced with respect to
the I k value for a given organism. In the first regime,
0
20
40
60
80
100
120
0
5
10
15
20
Light path position z (cm)
Light intensity I (z) (µmol photons m
–2 s
–1 )
0.5 g L
–1
1.0 g L
–1
2.0 g L
–1
C x
Fig. 9.17 Calculated light intensity (I) versus light path
position (z) and cell density (C x ) for one-dimensional light
transfer through well-mixed cell suspension culture of total light path length L D 20 cm. Model input parameters:
I o D 100 mol photons m
2 s
1 , k c D 0:1 L .g cell cm/
1