

136
While the above data represents an example of spectral changes
in a horizontal plane, these changes are also accentuated in vertical
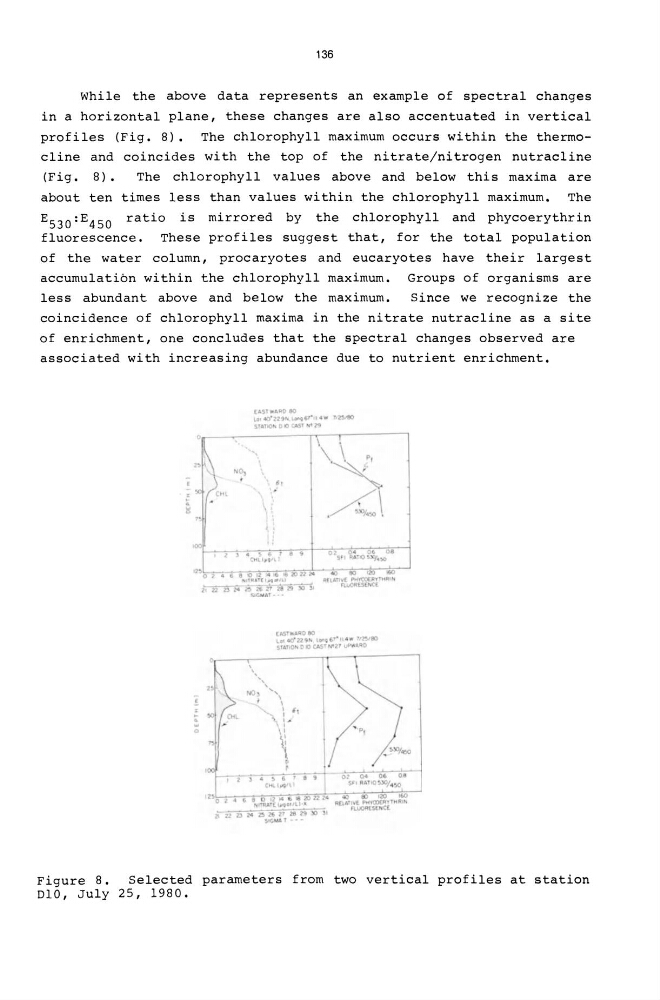
profiles (Fig. 8). The chlorophyll maximum occurs within the thermocline and coincides with the top of the nitrate/nitrogen nutracline
(Fig. 8).
The chlorophyll values above and below this maxima are
about ten times less than values within the chlorophyll maximum. The
ES30 :E 450 ratio is mirrored by the chlorophyll and phycoerythrin
fluorescence. These profiles suggest that, for the total population
of the water column, procaryotes and eucaryotes have their largest
accumulation within the chlorophyll maximum. Groups of organisms are
less abundant above and below the maximum.
Since we recognize the
coincidence of chlorophyll maxima in the nitrate nutracline as a site
of enrichment, one concludes that the spectral changes observed are
associated with increasing abundance due to nutrient enrichment.
'.
(AST .... AJ;lD eo
LOI-o"2'2'9"'L0f>9f>f·II"'W'/~
SlA.nor. 010 tAS1 ,.. 2'J
\\ PI
,
,
40
110
120
MiO
212Z 2324 2!t 26zt Z't2'l JO
~G ""' ''T ···
tAShUOIO
AU"tllI'( Ptf'rt'()(ItYTHRI~
n,1"o()R[5[HCl
1.01 -0"2'1'9"" l ... .q '-1\ 4 * 1,&10
STA.TIO'" 0 10 CAST N"I2" uPWARO
lao 1 • Ei 'N~~t':o::/~.::-2214
tJl2D14 ~2fj2128t9l:)31
SlOMA T • - ~
Figure 8.
Selected parameters from two vertical profiles at station
010, July 25, 1980.
While the above data represents an example of spectral changes
in a horizontal plane, these changes are also accentuated in vertical
profiles (Fig. 8). The chlorophyll maximum occurs within the thermocline and coincides with the top of the nitrate/nitrogen nutracline
(Fig. 8).
The chlorophyll values above and below this maxima are
about ten times less than values within the chlorophyll maximum. The
ES30 :E 450 ratio is mirrored by the chlorophyll and phycoerythrin
fluorescence. These profiles suggest that, for the total population
of the water column, procaryotes and eucaryotes have their largest
accumulation within the chlorophyll maximum. Groups of organisms are
less abundant above and below the maximum.
Since we recognize the
coincidence of chlorophyll maxima in the nitrate nutracline as a site
of enrichment, one concludes that the spectral changes observed are
associated with increasing abundance due to nutrient enrichment.
'.
(AST .... AJ;lD eo
LOI-o"2'2'9"'L0f>9f>f·II"'W'/~
SlA.nor. 010 tAS1 ,.. 2'J
\\ PI
,
,
40
110
120
MiO
212Z 2324 2!t 26zt Z't2'l JO
~G ""' ''T ···
tAShUOIO
AU"tllI'( Ptf'rt'()(ItYTHRI~
n,1"o()R[5[HCl
1.01 -0"2'1'9"" l ... .q '-1\ 4 * 1,&10
STA.TIO'" 0 10 CAST N"I2" uPWARO
lao 1 • Ei 'N~~t':o::/~.::-2214
tJl2D14 ~2fj2128t9l:)31
SlOMA T • - ~
Figure 8.
Selected parameters from two vertical profiles at station
010, July 25, 1980.