

115
2
total open pore area was 35.5 cm.
Each cage contained 287 ml
yielding a ratio of open pore area to volume of 0.12. Replicate cages
were incubated in the same tank as the dialysis tubes, either mounted
on the wheel or suspended within the tank.
Furnas (1982a) found no
difference in the growth rates of populations incubated in stationary
and rotating cages.
Nitrogen transport rates were determined using dialysis tubes
which were 1.6 cm in diameter, 25 cm long with a volume of 50 ml and
an A/V ratio of 2.5.
Ten replicate tubes were filled with filtered
sea water to which ammonium or phosphate was added to achieve a final
concentration of 5 ~M. Two tubes were removed and the tank water was
sampled at 15 min. intervals.
Ammonium and phosphate concentrations
were determined on a Technicon AutoAnalyzer(R). Transport rates were
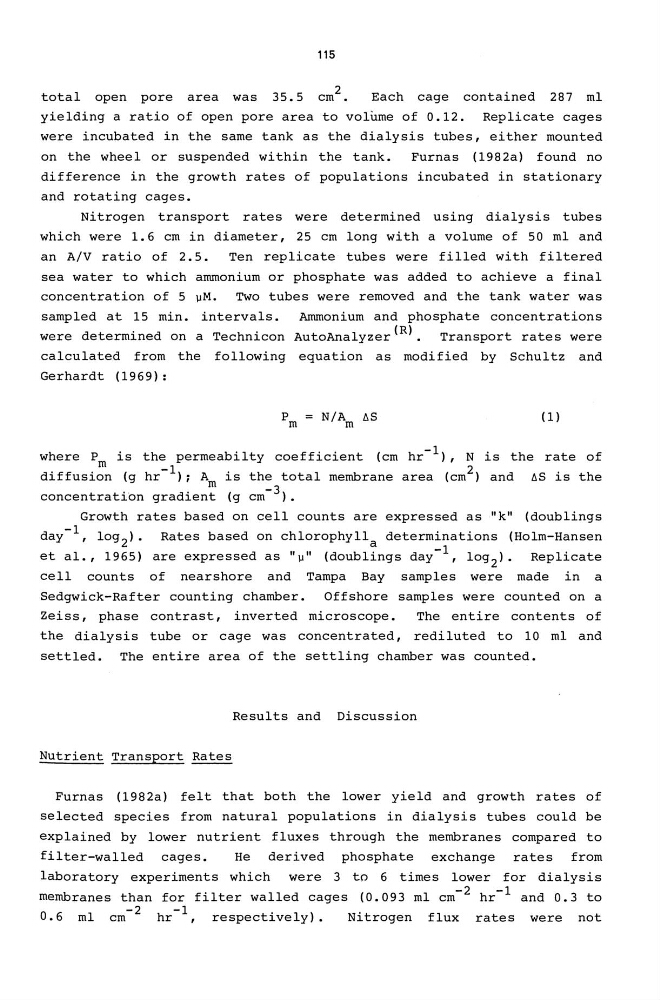
calculated from the following equation as modified by Schultz and
Gerhardt (1969):
(1)
where Pm is the permeabilty coefficient (cm hr- 1 ) , N is the rate of
diffusion (g hr-l)~ Am is the total membrane area (cm 2 ) and AS is the
concentration gradient (g cm- 3 ).
Growth rates based on cell counts are expressed as uk" (doublings
-1
day ,log2). Rates based on chlorophylla determinations (Holm-Hansen
et al., 1965) are expressed as "~" (doublings day-I, log2). Replicate
cell counts of nearshore and Tampa Bay samples were made in a
Sedgwick-Rafter counting chamber. Offshore samples were counted on a
Zeiss, phase contrast, inverted microscope.
The entire contents of
the dialysis tube or cage was concentrated, rediluted to 10 ml and
settled. The entire area of the settling chamber was counted.
Results and Discussion
Nutrient Transport Rates
Furnas (1982a) felt that both the lower yield and growth rates of
selected species from natural populations in dialysis tubes could be
explained by lower nutrient fluxes through the membranes compared to
filter-walled cages.
He derived phosphate exchange rates from
laboratory experiments which were 3 to 6 times lower for dialysis
membranes than for filter walled cages (0.093 ml cm- 2 hr- 1 and 0.3 to
-2
-1
0.6 ml cm
h r , respectively).
Nitrogen flux rates were not
2
total open pore area was 35.5 cm.
Each cage contained 287 ml
yielding a ratio of open pore area to volume of 0.12. Replicate cages
were incubated in the same tank as the dialysis tubes, either mounted
on the wheel or suspended within the tank.
Furnas (1982a) found no
difference in the growth rates of populations incubated in stationary
and rotating cages.
Nitrogen transport rates were determined using dialysis tubes
which were 1.6 cm in diameter, 25 cm long with a volume of 50 ml and
an A/V ratio of 2.5.
Ten replicate tubes were filled with filtered
sea water to which ammonium or phosphate was added to achieve a final
concentration of 5 ~M. Two tubes were removed and the tank water was
sampled at 15 min. intervals.
Ammonium and phosphate concentrations
were determined on a Technicon AutoAnalyzer(R). Transport rates were
calculated from the following equation as modified by Schultz and
Gerhardt (1969):
(1)
where Pm is the permeabilty coefficient (cm hr- 1 ) , N is the rate of
diffusion (g hr-l)~ Am is the total membrane area (cm 2 ) and AS is the
concentration gradient (g cm- 3 ).
Growth rates based on cell counts are expressed as uk" (doublings
-1
day ,log2). Rates based on chlorophylla determinations (Holm-Hansen
et al., 1965) are expressed as "~" (doublings day-I, log2). Replicate
cell counts of nearshore and Tampa Bay samples were made in a
Sedgwick-Rafter counting chamber. Offshore samples were counted on a
Zeiss, phase contrast, inverted microscope.
The entire contents of
the dialysis tube or cage was concentrated, rediluted to 10 ml and
settled. The entire area of the settling chamber was counted.
Results and Discussion
Nutrient Transport Rates
Furnas (1982a) felt that both the lower yield and growth rates of
selected species from natural populations in dialysis tubes could be
explained by lower nutrient fluxes through the membranes compared to
filter-walled cages.
He derived phosphate exchange rates from
laboratory experiments which were 3 to 6 times lower for dialysis
membranes than for filter walled cages (0.093 ml cm- 2 hr- 1 and 0.3 to
-2
-1
0.6 ml cm
h r , respectively).
Nitrogen flux rates were not