

727
pre-restoration to “as built” to post-restoration. A number of lines were drawn
across the surfaces in each DEM to extract profiles across the openings and over the
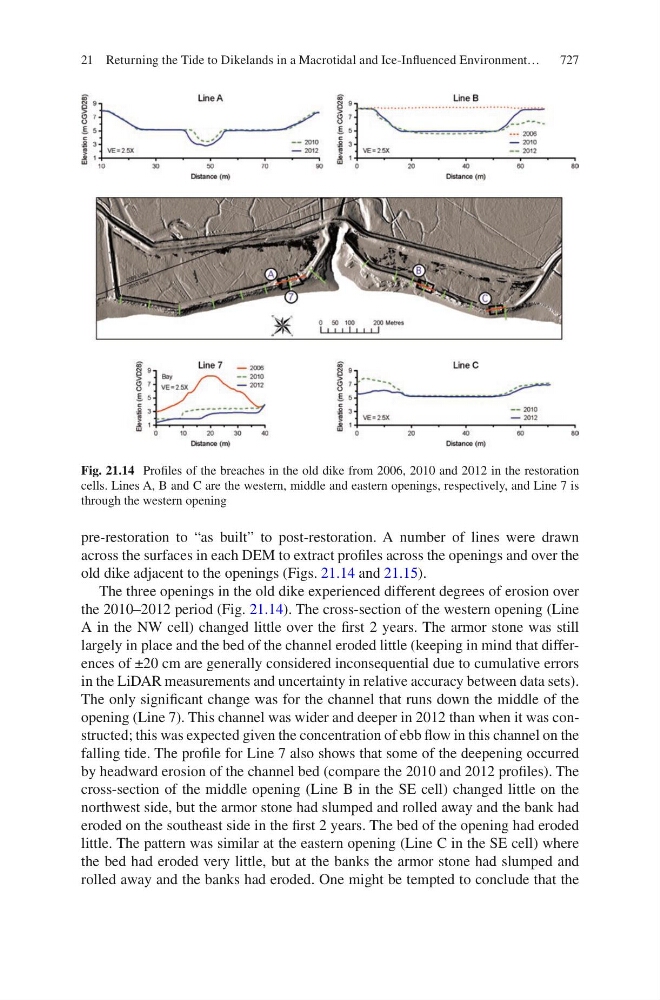
old dike adjacent to the openings (Figs. 21.14 and 21.15).
The three openings in the old dike experienced different degrees of erosion over
the 2010–2012 period (Fig. 21.14). The cross-section of the western opening (Line
A in the NW cell) changed little over the first 2 years. The armor stone was still
largely in place and the bed of the channel eroded little (keeping in mind that differences of ±20 cm are generally considered inconsequential due to cumulative errors
in the LiDAR measurements and uncertainty in relative accuracy between data sets).
The only significant change was for the channel that runs down the middle of the
opening (Line 7). This channel was wider and deeper in 2012 than when it was constructed; this was expected given the concentration of ebb flow in this channel on the
falling tide. The profile for Line 7 also shows that some of the deepening occurred
by headward erosion of the channel bed (compare the 2010 and 2012 profiles). The
cross-section of the middle opening (Line B in the SE cell) changed little on the
northwest side, but the armor stone had slumped and rolled away and the bank had
eroded on the southeast side in the first 2 years. The bed of the opening had eroded
little. The pattern was similar at the eastern opening (Line C in the SE cell) where
the bed had eroded very little, but at the banks the armor stone had slumped and
rolled away and the banks had eroded. One might be tempted to conclude that the
Fig. 21.14 Profiles of the breaches in the old dike from 2006, 2010 and 2012 in the restoration
cells. Lines A, B and C are the western, middle and eastern openings, respectively, and Line 7 is
through the western opening
21 Returning the Tide to Dikelands in a Macrotidal and Ice-Influenced Environment…