

725
in the restoration cells, and the measurements compared well (Pearson correlation,
r
2
> 0.93, n = 32–39, p < 0.001 for each year). Thus, it was concluded that there was
no systematic error between the methods. For analysis, the coring measurements
were used unless not available. As noted above, the RTK DGPS error is on the order
of 1–2 cm, which for 5 cm of deposition would be substantial, but for 50 cm of
deposition, it is not.
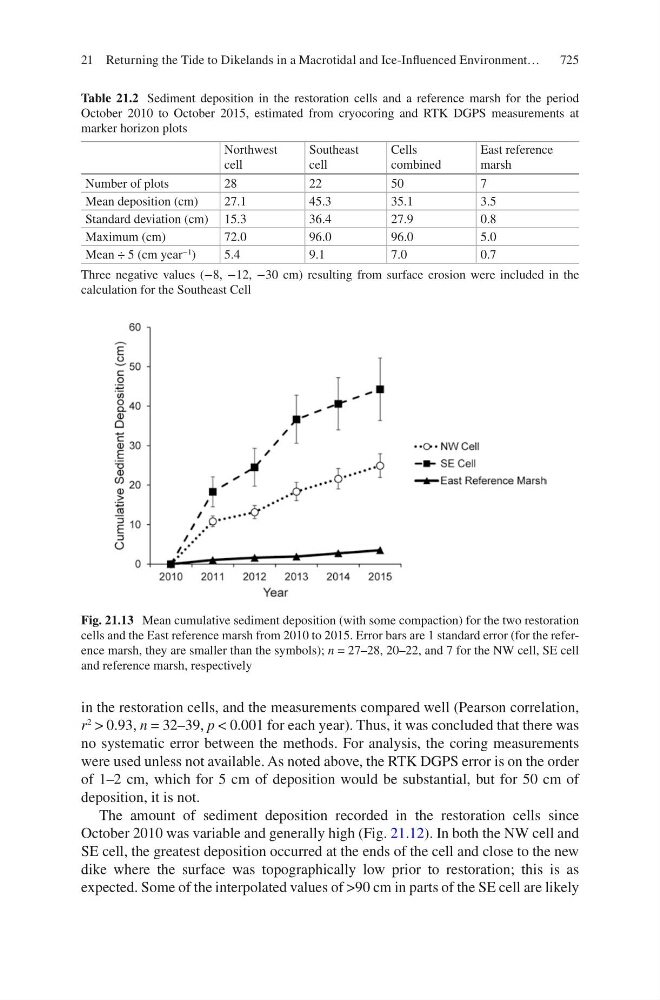
The amount of sediment deposition recorded in the restoration cells since
October 2010 was variable and generally high (Fig. 21.12). In both the NW cell and
SE cell, the greatest deposition occurred at the ends of the cell and close to the new
dike where the surface was topographically low prior to restoration; this is as
expected. Some of the interpolated values of >90 cm in parts of the SE cell are likely
Table 21.2 Sediment deposition in the restoration cells and a reference marsh for the period
October 2010 to October 2015, estimated from cryocoring and RTK DGPS measurements at
marker horizon plots
Northwest
cell
Southeast
cell
Cells
combined
East reference
marsh
Number of plots
28
22
50
7
Mean deposition (cm)
27.1
45.3
35.1
3.5
Standard deviation (cm) 15.3
36.4
27.9
0.8
Maximum (cm)
72.0
96.0
96.0
5.0
Mean ÷ 5 (cm year
−1
)
5.4
9.1
7.0
0.7
Three negative values (−8, −12, −30 cm) resulting from surface erosion were included in the
calculation for the Southeast Cell
Fig. 21.13 Mean cumulative sediment deposition (with some compaction) for the two restoration
cells and the East reference marsh from 2010 to 2015. Error bars are 1 standard error (for the reference marsh, they are smaller than the symbols); n = 27–28, 20–22, and 7 for the NW cell, SE cell
and reference marsh, respectively
21 Returning the Tide to Dikelands in a Macrotidal and Ice-Influenced Environment…