

616
monsoon and pre monsoon data of 2005, 2006, 2007 and 2008 have been used to
assess the mangrove health. Primary data such as vegetation field survey in mangrove forests using sample survey and track survey, presence of anthropogenic pressure (pollution, dredging, grazing, reclamation etc) using reconnaissance survey
and the location of user villages of the mangroves were collected and used (Ajai
et al. 2012).
The methodology as discussed above has been used to generate the spatial thematic layers for each of the 12 environmental indicators (as given in Table 19.4) for
the study area. The details on the computation for each of the12 themes, for
Pichhavaram reserve forest are summarized below. These theme maps were prepared using multi date satellite data as well as field surveys/measurements (Ajai
et al. 2012).
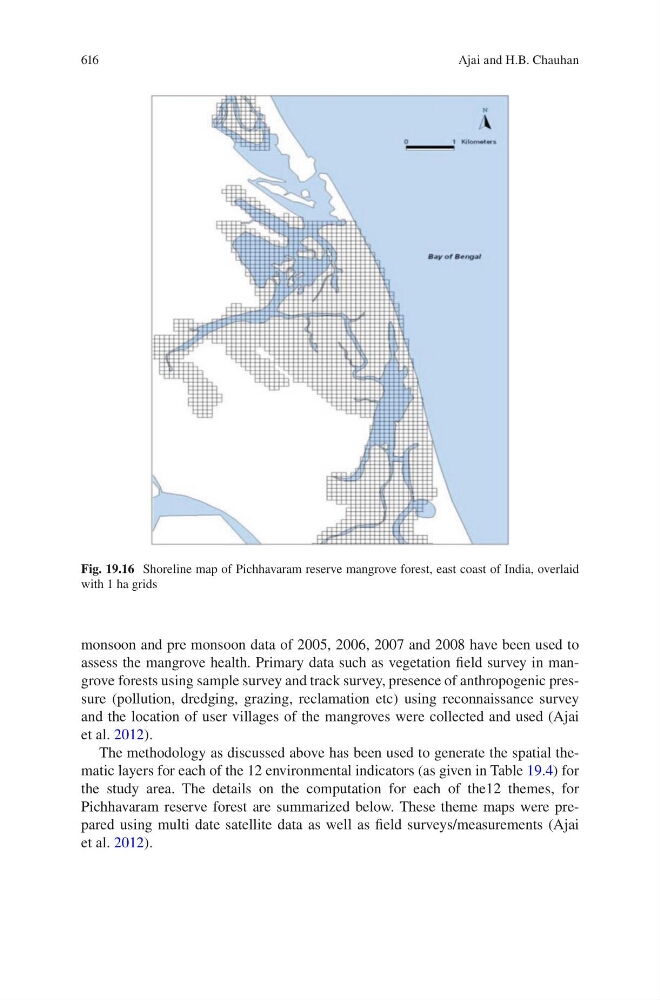
Fig. 19.16 Shoreline map of Pichhavaram reserve mangrove forest, east coast of India, overlaid
with 1 ha grids
Ajai and H.B. Chauhan