

609
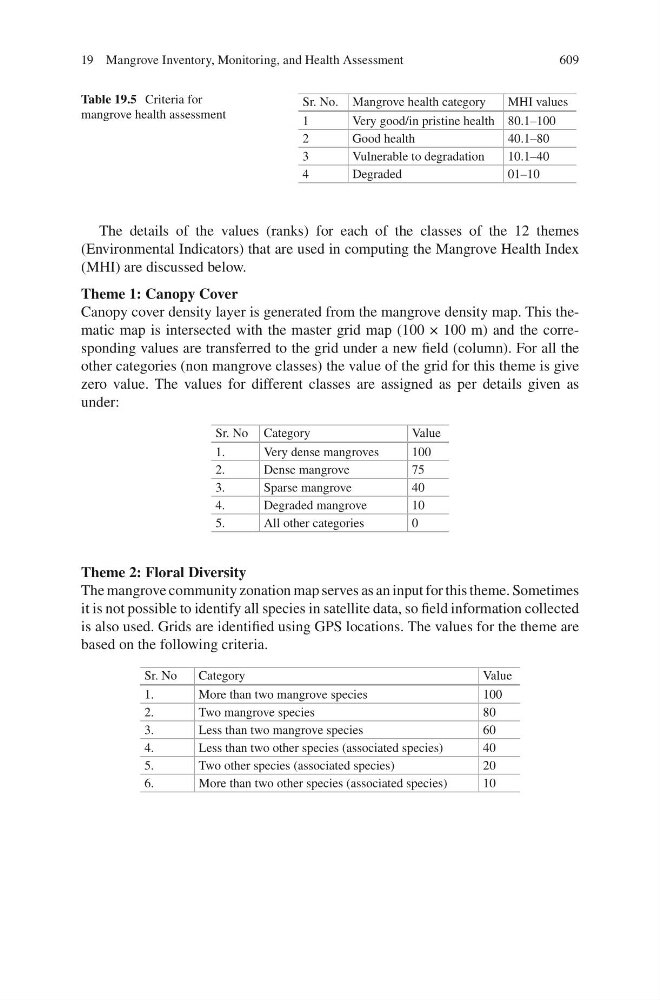
The details of the values (ranks) for each of the classes of the 12 themes
(Environmental Indicators) that are used in computing the Mangrove Health Index
(MHI) are discussed below.
Theme 1: Canopy Cover
Canopy cover density layer is generated from the mangrove density map. This thematic map is intersected with the master grid map (100 × 100 m) and the corresponding values are transferred to the grid under a new field (column). For all the
other categories (non mangrove classes) the value of the grid for this theme is give
zero value. The values for different classes are assigned as per details given as
under:
Sr. No Category
Value
1.
Very dense mangroves
100
2.
Dense mangrove
75
3.
Sparse mangrove
40
4.
Degraded mangrove
10
5.
All other categories
0
Theme 2: Floral Diversity
The mangrove community zonation map serves as an input for this theme. Sometimes
it is not possible to identify all species in satellite data, so field information collected
is also used. Grids are identified using GPS locations. The values for the theme are
based on the following criteria.
Sr. No
Category
Value
1.
More than two mangrove species
100
2.
Two mangrove species
80
3.
Less than two mangrove species
60
4.
Less than two other species (associated species)
40
5.
Two other species (associated species)
20
6.
More than two other species (associated species)
10
Table 19.5 Criteria for
mangrove health assessment
Sr. No. Mangrove health category
MHI values
1
Very good/in pristine health 80.1–100
2
Good health
40.1–80
3
Vulnerable to degradation
10.1–40
4
Degraded
01–10
19 Mangrove Inventory, Monitoring, and Health Assessment