

608
The Model Framework
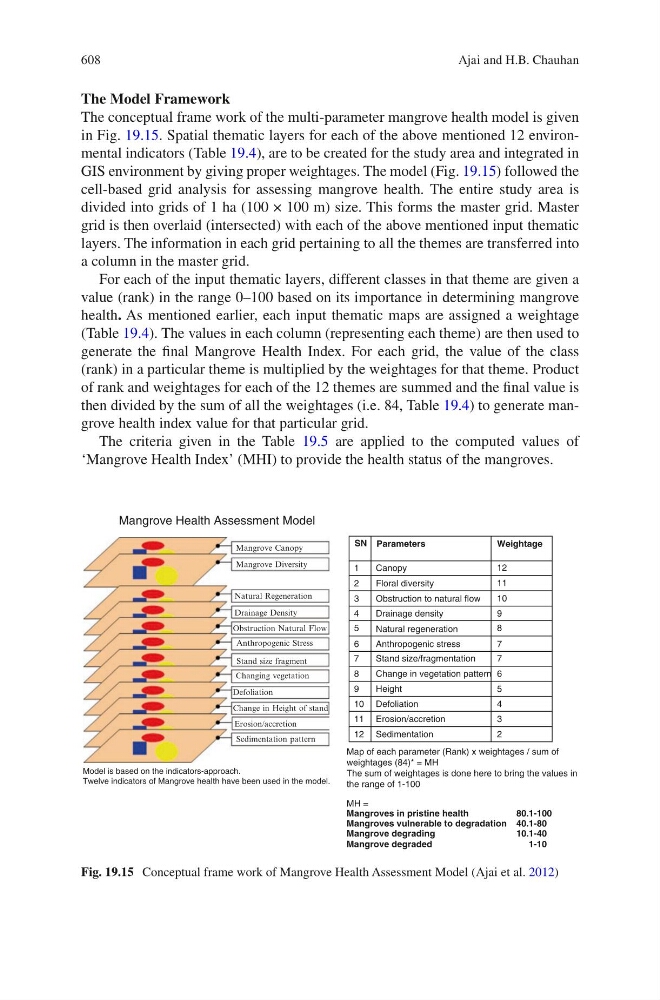
The conceptual frame work of the multi-parameter mangrove health model is given
in Fig. 19.15. Spatial thematic layers for each of the above mentioned 12 environmental indicators (Table 19.4), are to be created for the study area and integrated in
GIS environment by giving proper weightages. The model (Fig. 19.15) followed the
cell-based grid analysis for assessing mangrove health. The entire study area is
divided into grids of 1 ha (100 × 100 m) size. This forms the master grid. Master
grid is then overlaid (intersected) with each of the above mentioned input thematic
layers. The information in each grid pertaining to all the themes are transferred into
a column in the master grid.
For each of the input thematic layers, different classes in that theme are given a
value (rank) in the range 0–100 based on its importance in determining mangrove
health. As mentioned earlier, each input thematic maps are assigned a weightage
(Table 19.4). The values in each column (representing each theme) are then used to
generate the final Mangrove Health Index. For each grid, the value of the class
(rank) in a particular theme is multiplied by the weightages for that theme. Product
of rank and weightages for each of the 12 themes are summed and the final value is
then divided by the sum of all the weightages (i.e. 84, Table 19.4) to generate mangrove health index value for that particular grid.
The criteria given in the Table 19.5 are applied to the computed values of
‘Mangrove Health Index’ (MHI) to provide the health status of the mangroves.
Mangrove Health Assessment Model
Model is based on the indicators-approach.
Twelve indicators of Mangrove health have been used in the model.
Mangrove Canopy
Mangrove Diversity
Natural Regeneration
Drainage Density
Obstruction Natural Flow
Anthropogenic Stress
Stand size fragment
Changing vegetation
Defoliation
Change in Height of stand
Erosion/accretion
Sedimentation pattern
SN Parameters
Weightage
1
Canopy
Anthropogenic stress
Stand size/fragmentation
Change in vegetation pattern
Height
Defoliation
Erosion/accretion
Sedimentation
Natural regeneration
Drainage density
12
2
Floral diversity
11
3
4
5
6
7
8
9
10
11
12
MH =
Mangroves in pristine health
80.1-100
Mangroves vulnerable to degradation 40.1-80
Mangrove degrading
10.1-40
Mangrove degraded
1-10
Obstruction to natural flow
10
9
8
7
7
6
5
4
3
2
Map of each parameter (Rank) x weightages / sum of
weightages (84)* = MH
The sum of weightages is done here to bring the values in
the range of 1-100
Fig. 19.15 Conceptual frame work of Mangrove Health Assessment Model (Ajai et al. 2012)
Ajai and H.B. Chauhan