

603
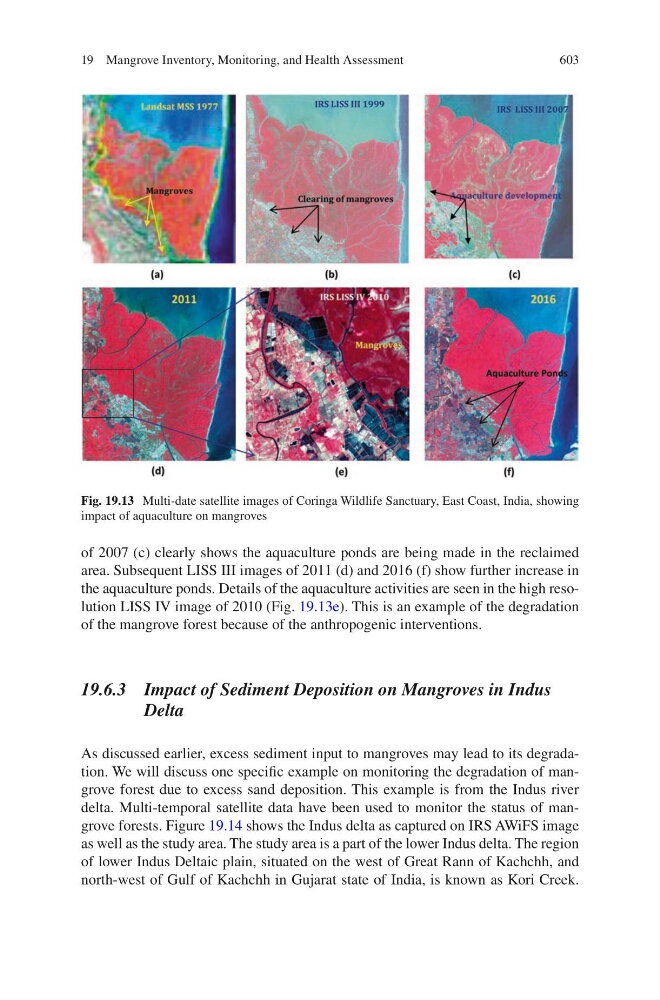
of 2007 (c) clearly shows the aquaculture ponds are being made in the reclaimed
area. Subsequent LISS III images of 2011 (d) and 2016 (f) show further increase in
the aquaculture ponds. Details of the aquaculture activities are seen in the high resolution LISS IV image of 2010 (Fig. 19.13e). This is an example of the degradation
of the mangrove forest because of the anthropogenic interventions.
19.6.3 Impact of Sediment Deposition on Mangroves in Indus
Delta
As discussed earlier, excess sediment input to mangroves may lead to its degradation. We will discuss one specific example on monitoring the degradation of mangrove forest due to excess sand deposition. This example is from the Indus river
delta. Multi-temporal satellite data have been used to monitor the status of mangrove forests. Figure 19.14 shows the Indus delta as captured on IRS AWiFS image
as well as the study area. The study area is a part of the lower Indus delta. The region
of lower Indus Deltaic plain, situated on the west of Great Rann of Kachchh, and
north-west of Gulf of Kachchh in Gujarat state of India, is known as Kori Creek.
Fig. 19.13 Multi-date satellite images of Coringa Wildlife Sanctuary, East Coast, India, showing
impact of aquaculture on mangroves
19 Mangrove Inventory, Monitoring, and Health Assessment