

598
using multi-temporal satellite data and same methodology (Nayak and Bahuguna
2001; Bahuguna et al. 2007). Integrated output of the above two studies is shown in
Fig. 19.12. It provides the area under mangrove forest cover during 11 different
years, over a span of 36 years (1975–2011). It also provided the status of the mangrove crown density (dense and sparse) during each of the above 11 years. Significant
changes in the mangrove forest area were observed during the period 1975–2011.
Figure 19.12 shows that the degradation of mangrove forest continued from 1975 to
1985. This was, mainly, due to cutting of mangroves by local, people for fuel and
fodder. Once the area was declared as marine national park in 1985, extensive conservation measures were taken by the state forest department. This had resulted in
reversing the trend of degradation of the mangrove ecosystem after 1985 and helped
towards restoring the environment till 1993. Degradation of mangroves after 1993
has increased due to anthropogenic pressure and oil spills. There has been sharp
decrease in the area of, both dense and sparse mangroves, during 1975–1982. This
reduction was attributed to the cutting of mangroves for fuel, grazing, mining and
dredging, creation of salt pans on the coast, coastal development, oil and other
chemical hazards, creation of harbours and ship breaking yards and waste disposal
by steamers (Bahuguna et al. 2007). During 1985–1993, the area under mangroves
increased and density also improved due to conservation measures taken after the
notification of the area as marine national park. The condition of the mangroves
deteriorated due to oil spill in October 1998 and the decline in the mangrove area
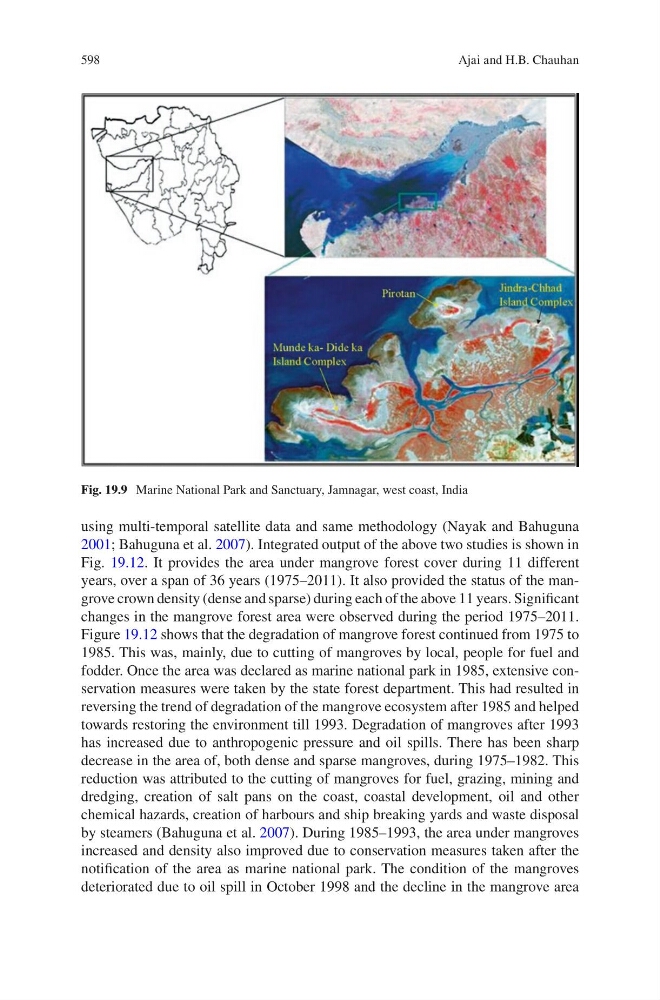
Fig. 19.9 Marine National Park and Sanctuary, Jamnagar, west coast, India
Ajai and H.B. Chauhan