

585
monitoring. As the mangrove forests are tide inundated, care should be taken to use
the satellite data acquired during the period of low tide. For delineating fringe mangroves along narrow creeks and young/new plantations, very high resolution (about
one meter) satellite data may also be required as supporting data for better interpretations. Satellite data in short wave infra-red band is very effective for differentiating mangroves from the adjacent other vegetative covers.
The basic premise on which the zonations of mangrove communities using spectral data are done, is based on the fact that each of the ‘mangrove community
classes’ have different reflectance or radiance/DN numbers in different spectral
bands of the multispectral data sets acquired by the EO satellites (Nayak and
Bahuguna 2001). Thus these classes are separable in multi-dimensional spectral
feature space.
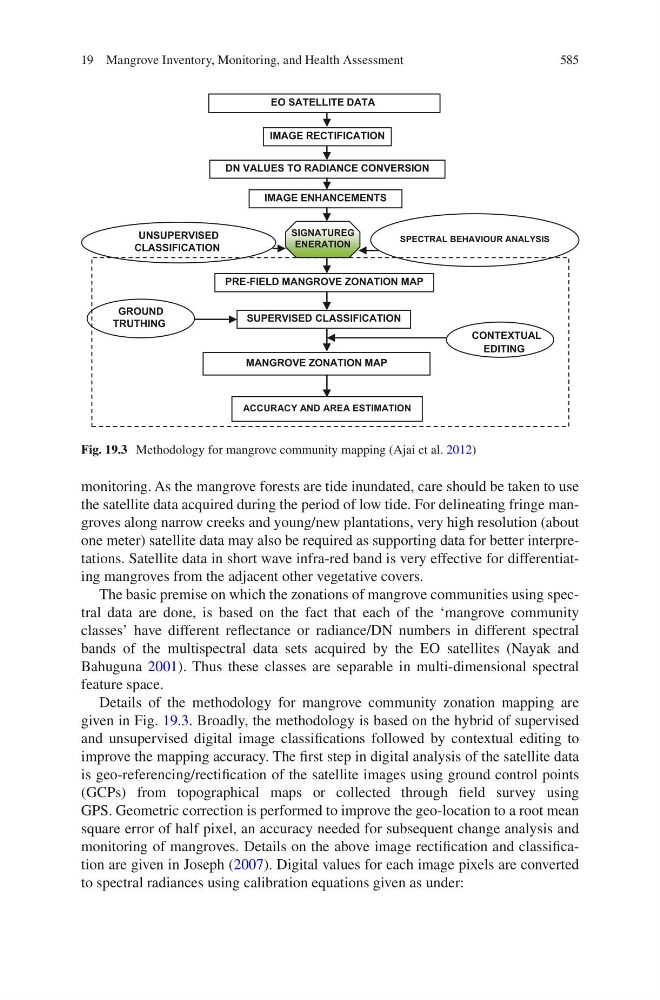
Details of the methodology for mangrove community zonation mapping are
given in Fig. 19.3. Broadly, the methodology is based on the hybrid of supervised
and unsupervised digital image classifications followed by contextual editing to
improve the mapping accuracy. The first step in digital analysis of the satellite data
is geo-referencing/rectification of the satellite images using ground control points
(GCPs) from topographical maps or collected through field survey using
GPS. Geometric correction is performed to improve the geo-location to a root mean
square error of half pixel, an accuracy needed for subsequent change analysis and
monitoring of mangroves. Details on the above image rectification and classification are given in Joseph (2007). Digital values for each image pixels are converted
to spectral radiances using calibration equations given as under:
EO SATELLITE DATA
IMAGE RECTIFICATION
DN VALUES TO RADIANCE CONVERSION
SUPERVISED CLASSIFICATION
PRE-FIELD MANGROVE ZONATION MAP
MANGROVE ZONATION MAP
IMAGE ENHANCEMENTS
CONTEXTUAL
EDITING
SIGNATUREG
ENERATION
SPECTRAL BEHAVIOUR ANALYSIS
GROUND
TRUTHING
UNSUPERVISED
CLASSIFICATION
ACCURACY AND AREA ESTIMATION
Fig. 19.3 Methodology for mangrove community mapping (Ajai et al. 2012)
19 Mangrove Inventory, Monitoring, and Health Assessment