

548
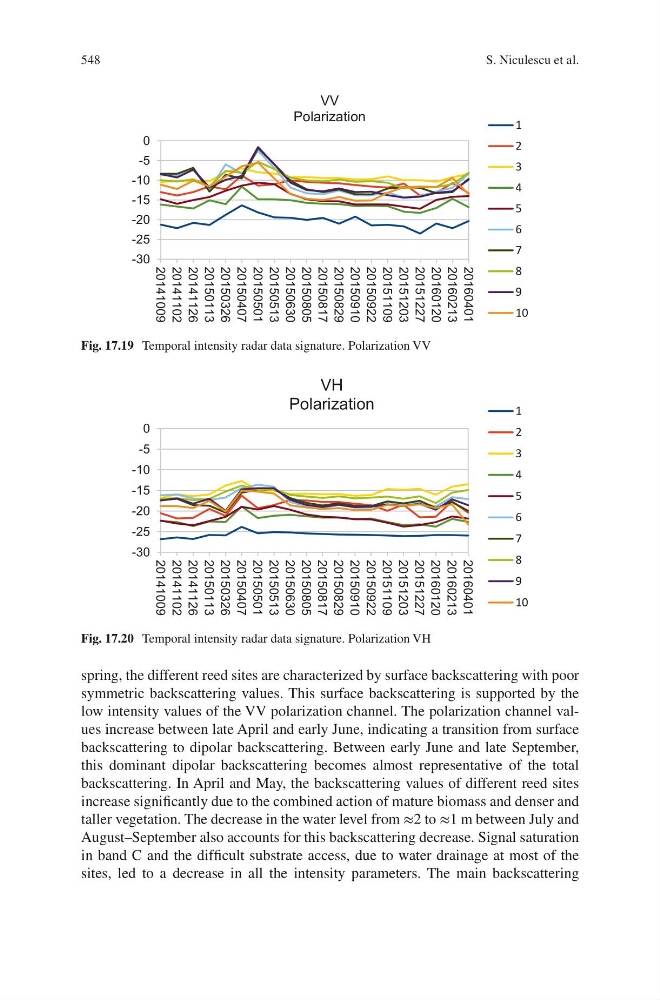
spring, the different reed sites are characterized by surface backscattering with poor
symmetric backscattering values. This surface backscattering is supported by the
low intensity values of the VV polarization channel. The polarization channel values increase between late April and early June, indicating a transition from surface
backscattering to dipolar backscattering. Between early June and late September,
this dominant dipolar backscattering becomes almost representative of the total
backscattering. In April and May, the backscattering values of different reed sites
increase significantly due to the combined action of mature biomass and denser and
taller vegetation. The decrease in the water level from ≈2 to ≈1 m between July and
August–September also accounts for this backscattering decrease. Signal saturation
in band C and the difficult substrate access, due to water drainage at most of the
sites, led to a decrease in all the intensity parameters. The main backscattering
-30
-25
-20
-15
-10
-5
0
20141009
20141102
20141126
20150113
20150326
20150407
20150501
20150513
20150630
20150805
20150817
20150829
20150910
20150922
20151109
20151203
20151227
20160120
20160213
20160401
VV
Polarization
1
2
3
4
5
6
7
8
9
10
Fig. 17.19 Temporal intensity radar data signature. Polarization VV
-30
-25
-20
-15
-10
-5
0
20141009
20141102
20141126
20150113
20150326
20150407
20150501
20150513
20150630
20150805
20150817
20150829
20150910
20150922
20151109
20151203
20151227
20160120
20160213
20160401
VH
Polarization
1
2
3
4
5
6
7
8
9
10
Fig. 17.20 Temporal intensity radar data signature. Polarization VH
S. Niculescu et al.