

444
• Nalaban Island Ecosystem Conservation Programme for Migratory Bird
• Weed management with community participation and use in bio gas generation
• Hydrobiological monitoring
• Mass awareness programme
• Fishery Resource Development programme (net mesh-size regulation, prohibiting catching brood fish and prawn juveniles, identification)
• Upliftment of Socio Economic Condition of Rural Community around the lake
• Setting up Wetland Management Research Centre at Balugaon.
• Improvement of road network around Chilka.
Due to the restoration measure the following improvements were observed in the
chilika lake wetland ecosystem. There have been remarkable changes in the ecosystem of the Chilka Lake after the restoration process. The major achievements were:
1. Salinity Change: Salinity level in the northern sector changed from 0.5 to 2.5 ppt
recorded in the last decade to 0.1–36.00 ppt.
2. Fishery productivity: The fish land, which had declined to 1,600 mt before intervention changed to 11,877 mt in 2001–2002 and crab landing increased from 3
mt in 1994–1995 to 150 mts in 2002–2003. There is also a marked change in
ranking order (Fig. 14.7).
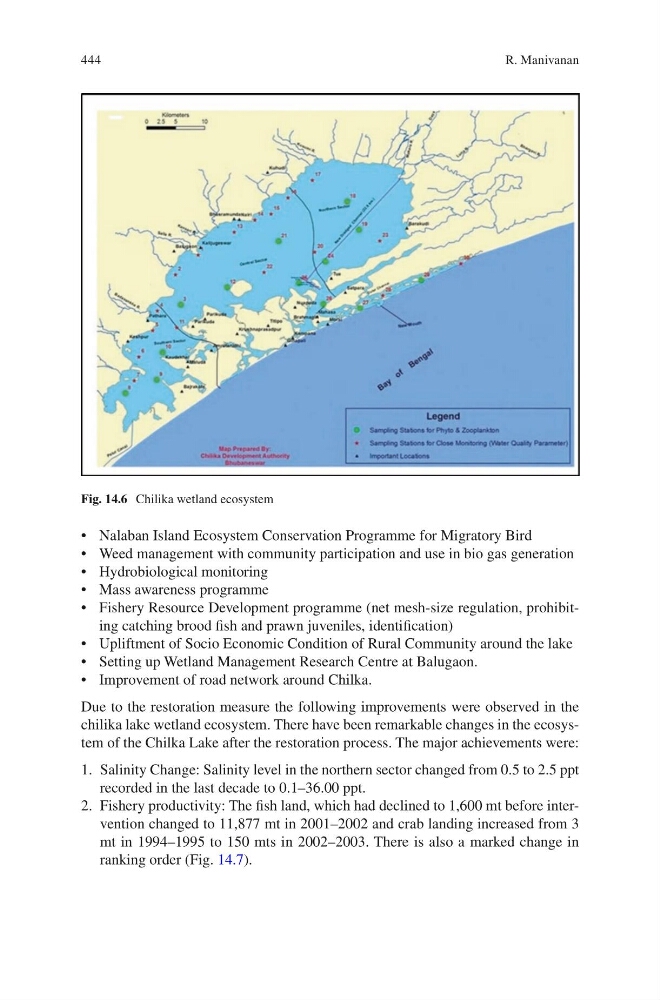
Fig. 14.6 Chilika wetland ecosystem
R. Manivanan
• Nalaban Island Ecosystem Conservation Programme for Migratory Bird
• Weed management with community participation and use in bio gas generation
• Hydrobiological monitoring
• Mass awareness programme
• Fishery Resource Development programme (net mesh-size regulation, prohibiting catching brood fish and prawn juveniles, identification)
• Upliftment of Socio Economic Condition of Rural Community around the lake
• Setting up Wetland Management Research Centre at Balugaon.
• Improvement of road network around Chilka.
Due to the restoration measure the following improvements were observed in the
chilika lake wetland ecosystem. There have been remarkable changes in the ecosystem of the Chilka Lake after the restoration process. The major achievements were:
1. Salinity Change: Salinity level in the northern sector changed from 0.5 to 2.5 ppt
recorded in the last decade to 0.1–36.00 ppt.
2. Fishery productivity: The fish land, which had declined to 1,600 mt before intervention changed to 11,877 mt in 2001–2002 and crab landing increased from 3
mt in 1994–1995 to 150 mts in 2002–2003. There is also a marked change in
ranking order (Fig. 14.7).
Fig. 14.6 Chilika wetland ecosystem
R. Manivanan