

387
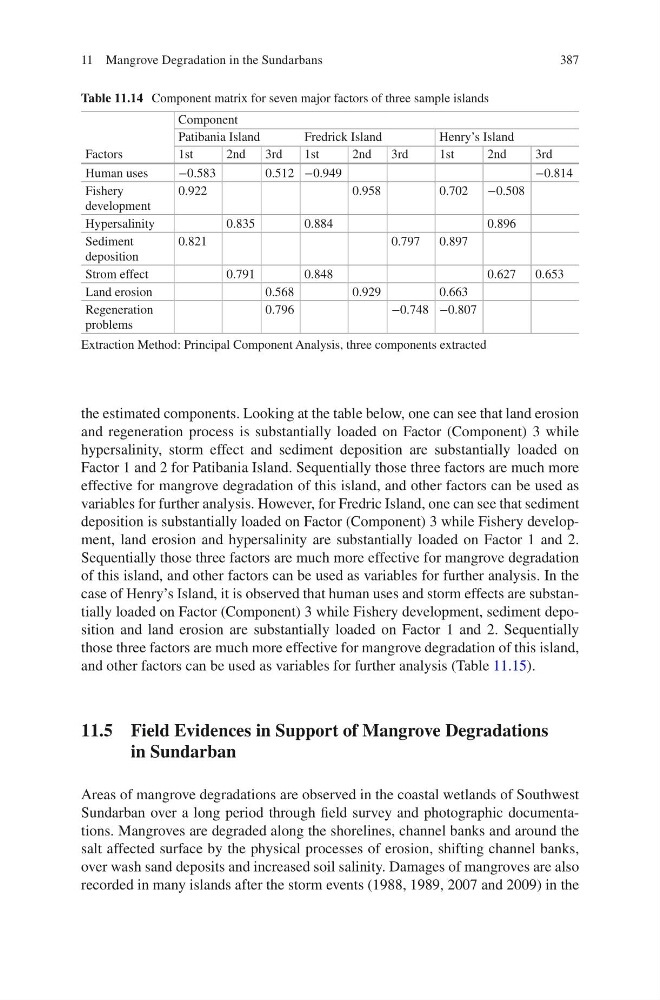
the estimated components. Looking at the table below, one can see that land erosion
and regeneration process is substantially loaded on Factor (Component) 3 while
hypersalinity, storm effect and sediment deposition are substantially loaded on
Factor 1 and 2 for Patibania Island. Sequentially those three factors are much more
effective for mangrove degradation of this island, and other factors can be used as
variables for further analysis. However, for Fredric Island, one can see that sediment
deposition is substantially loaded on Factor (Component) 3 while Fishery development, land erosion and hypersalinity are substantially loaded on Factor 1 and 2.
Sequentially those three factors are much more effective for mangrove degradation
of this island, and other factors can be used as variables for further analysis. In the
case of Henry’s Island, it is observed that human uses and storm effects are substantially loaded on Factor (Component) 3 while Fishery development, sediment deposition and land erosion are substantially loaded on Factor 1 and 2. Sequentially
those three factors are much more effective for mangrove degradation of this island,
and other factors can be used as variables for further analysis (Table 11.15).
11.5 Field Evidences in Support of Mangrove Degradations
in Sundarban
Areas of mangrove degradations are observed in the coastal wetlands of Southwest
Sundarban over a long period through field survey and photographic documentations. Mangroves are degraded along the shorelines, channel banks and around the
salt affected surface by the physical processes of erosion, shifting channel banks,
over wash sand deposits and increased soil salinity. Damages of mangroves are also
recorded in many islands after the storm events (1988, 1989, 2007 and 2009) in the
Table 11.14 Component matrix for seven major factors of three sample islands
Factors
Component
Patibania Island
Fredrick Island
Henry’s Island
1st
2nd
3rd
1st
2nd
3rd
1st
2nd
3rd
Human uses
−0.583
0.512 −0.949
−0.814
Fishery
development
0.922
0.958
0.702
−0.508
Hypersalinity
0.835
0.884
0.896
Sediment
deposition
0.821
0.797
0.897
Strom effect
0.791
0.848
0.627
0.653
Land erosion
0.568
0.929
0.663
Regeneration
problems
0.796
−0.748 −0.807
Extraction Method: Principal Component Analysis, three components extracted
11 Mangrove Degradation in the Sundarbans
the estimated components. Looking at the table below, one can see that land erosion
and regeneration process is substantially loaded on Factor (Component) 3 while
hypersalinity, storm effect and sediment deposition are substantially loaded on
Factor 1 and 2 for Patibania Island. Sequentially those three factors are much more
effective for mangrove degradation of this island, and other factors can be used as
variables for further analysis. However, for Fredric Island, one can see that sediment
deposition is substantially loaded on Factor (Component) 3 while Fishery development, land erosion and hypersalinity are substantially loaded on Factor 1 and 2.
Sequentially those three factors are much more effective for mangrove degradation
of this island, and other factors can be used as variables for further analysis. In the
case of Henry’s Island, it is observed that human uses and storm effects are substantially loaded on Factor (Component) 3 while Fishery development, sediment deposition and land erosion are substantially loaded on Factor 1 and 2. Sequentially
those three factors are much more effective for mangrove degradation of this island,
and other factors can be used as variables for further analysis (Table 11.15).
11.5 Field Evidences in Support of Mangrove Degradations
in Sundarban
Areas of mangrove degradations are observed in the coastal wetlands of Southwest
Sundarban over a long period through field survey and photographic documentations. Mangroves are degraded along the shorelines, channel banks and around the
salt affected surface by the physical processes of erosion, shifting channel banks,
over wash sand deposits and increased soil salinity. Damages of mangroves are also
recorded in many islands after the storm events (1988, 1989, 2007 and 2009) in the
Table 11.14 Component matrix for seven major factors of three sample islands
Factors
Component
Patibania Island
Fredrick Island
Henry’s Island
1st
2nd
3rd
1st
2nd
3rd
1st
2nd
3rd
Human uses
−0.583
0.512 −0.949
−0.814
Fishery
development
0.922
0.958
0.702
−0.508
Hypersalinity
0.835
0.884
0.896
Sediment
deposition
0.821
0.797
0.897
Strom effect
0.791
0.848
0.627
0.653
Land erosion
0.568
0.929
0.663
Regeneration
problems
0.796
−0.748 −0.807
Extraction Method: Principal Component Analysis, three components extracted
11 Mangrove Degradation in the Sundarbans