

378
11.4.3.1 Descriptive Statistics
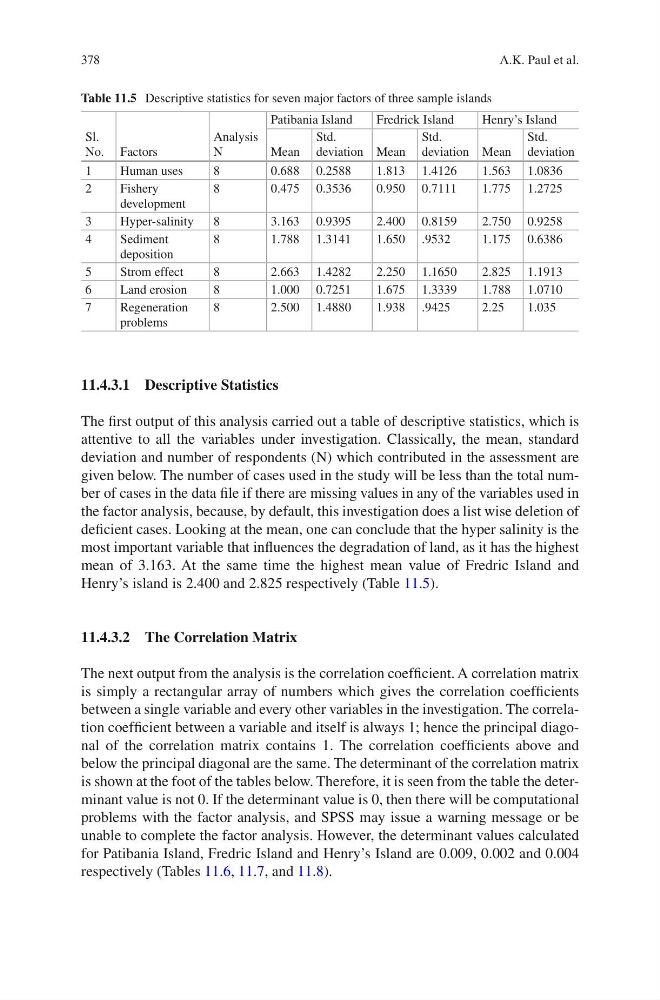
The first output of this analysis carried out a table of descriptive statistics, which is
attentive to all the variables under investigation. Classically, the mean, standard
deviation and number of respondents (N) which contributed in the assessment are
given below. The number of cases used in the study will be less than the total number of cases in the data file if there are missing values in any of the variables used in
the factor analysis, because, by default, this investigation does a list wise deletion of
deficient cases. Looking at the mean, one can conclude that the hyper salinity is the
most important variable that influences the degradation of land, as it has the highest
mean of 3.163. At the same time the highest mean value of Fredric Island and
Henry’s island is 2.400 and 2.825 respectively (Table 11.5).
11.4.3.2 The Correlation Matrix
The next output from the analysis is the correlation coefficient. A correlation matrix
is simply a rectangular array of numbers which gives the correlation coefficients
between a single variable and every other variables in the investigation. The correlation coefficient between a variable and itself is always 1; hence the principal diagonal of the correlation matrix contains 1. The correlation coefficients above and
below the principal diagonal are the same. The determinant of the correlation matrix
is shown at the foot of the tables below. Therefore, it is seen from the table the determinant value is not 0. If the determinant value is 0, then there will be computational
problems with the factor analysis, and SPSS may issue a warning message or be
unable to complete the factor analysis. However, the determinant values calculated
for Patibania Island, Fredric Island and Henry’s Island are 0.009, 0.002 and 0.004
respectively (Tables 11.6, 11.7, and 11.8).
Table 11.5 Descriptive statistics for seven major factors of three sample islands
Sl.
No. Factors
Analysis
N
Patibania Island
Fredrick Island
Henry’s Island
Mean
Std.
deviation Mean
Std.
deviation Mean
Std.
deviation
1
Human uses
8
0.688 0.2588
1.813 1.4126
1.563 1.0836
2
Fishery
development
8
0.475 0.3536
0.950 0.7111
1.775 1.2725
3
Hyper-salinity
8
3.163 0.9395
2.400 0.8159
2.750 0.9258
4
Sediment
deposition
8
1.788 1.3141
1.650 .9532
1.175 0.6386
5
Strom effect
8
2.663 1.4282
2.250 1.1650
2.825 1.1913
6
Land erosion
8
1.000 0.7251
1.675 1.3339
1.788 1.0710
7
Regeneration
problems
8
2.500 1.4880
1.938 .9425
2.25
1.035
A.K. Paul et al.
11.4.3.1 Descriptive Statistics
The first output of this analysis carried out a table of descriptive statistics, which is
attentive to all the variables under investigation. Classically, the mean, standard
deviation and number of respondents (N) which contributed in the assessment are
given below. The number of cases used in the study will be less than the total number of cases in the data file if there are missing values in any of the variables used in
the factor analysis, because, by default, this investigation does a list wise deletion of
deficient cases. Looking at the mean, one can conclude that the hyper salinity is the
most important variable that influences the degradation of land, as it has the highest
mean of 3.163. At the same time the highest mean value of Fredric Island and
Henry’s island is 2.400 and 2.825 respectively (Table 11.5).
11.4.3.2 The Correlation Matrix
The next output from the analysis is the correlation coefficient. A correlation matrix
is simply a rectangular array of numbers which gives the correlation coefficients
between a single variable and every other variables in the investigation. The correlation coefficient between a variable and itself is always 1; hence the principal diagonal of the correlation matrix contains 1. The correlation coefficients above and
below the principal diagonal are the same. The determinant of the correlation matrix
is shown at the foot of the tables below. Therefore, it is seen from the table the determinant value is not 0. If the determinant value is 0, then there will be computational
problems with the factor analysis, and SPSS may issue a warning message or be
unable to complete the factor analysis. However, the determinant values calculated
for Patibania Island, Fredric Island and Henry’s Island are 0.009, 0.002 and 0.004
respectively (Tables 11.6, 11.7, and 11.8).
Table 11.5 Descriptive statistics for seven major factors of three sample islands
Sl.
No. Factors
Analysis
N
Patibania Island
Fredrick Island
Henry’s Island
Mean
Std.
deviation Mean
Std.
deviation Mean
Std.
deviation
1
Human uses
8
0.688 0.2588
1.813 1.4126
1.563 1.0836
2
Fishery
development
8
0.475 0.3536
0.950 0.7111
1.775 1.2725
3
Hyper-salinity
8
3.163 0.9395
2.400 0.8159
2.750 0.9258
4
Sediment
deposition
8
1.788 1.3141
1.650 .9532
1.175 0.6386
5
Strom effect
8
2.663 1.4282
2.250 1.1650
2.825 1.1913
6
Land erosion
8
1.000 0.7251
1.675 1.3339
1.788 1.0710
7
Regeneration
problems
8
2.500 1.4880
1.938 .9425
2.25
1.035
A.K. Paul et al.