

377
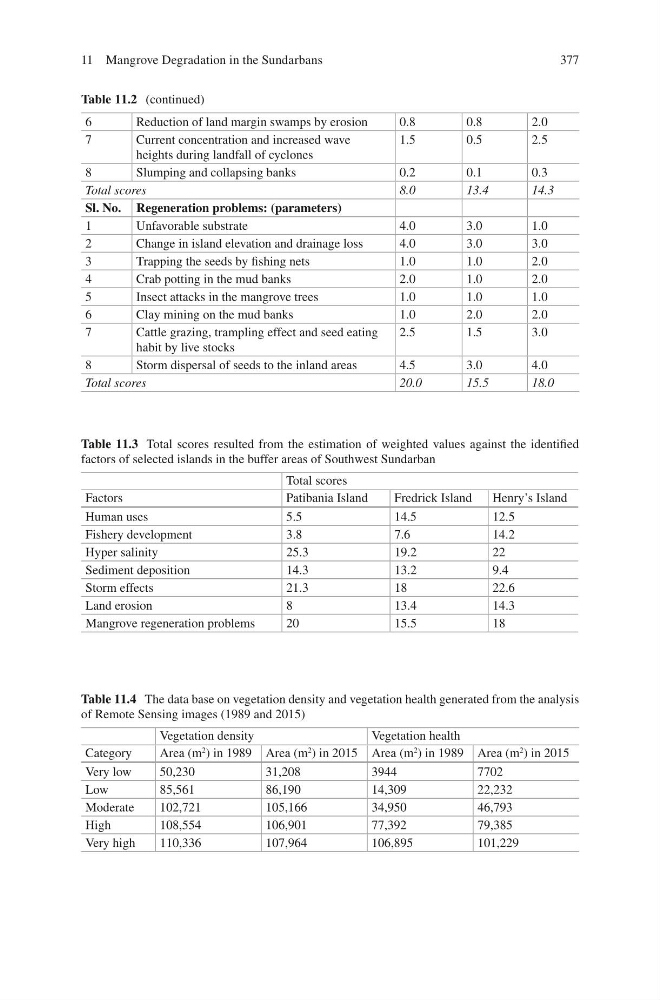
Table 11.4 The data base on vegetation density and vegetation health generated from the analysis
of Remote Sensing images (1989 and 2015)
Vegetation density
Vegetation health
Category
Area (m
2 ) in 1989 Area (m
2 ) in 2015 Area (m
2
) in 1989 Area (m
2
) in 2015
Very low
50,230
31,208
3944
7702
Low
85,561
86,190
14,309
22,232
Moderate
102,721
105,166
34,950
46,793
High
108,554
106,901
77,392
79,385
Very high
110,336
107,964
106,895
101,229
Table 11.2 (continued)
6
Reduction of land margin swamps by erosion
0.8
0.8
2.0
7
Current concentration and increased wave
heights during landfall of cyclones
1.5
0.5
2.5
8
Slumping and collapsing banks
0.2
0.1
0.3
Total scores
8.0
13.4
14.3
Sl. No. Regeneration problems: (parameters)
1
Unfavorable substrate
4.0
3.0
1.0
2
Change in island elevation and drainage loss
4.0
3.0
3.0
3
Trapping the seeds by fishing nets
1.0
1.0
2.0
4
Crab potting in the mud banks
2.0
1.0
2.0
5
Insect attacks in the mangrove trees
1.0
1.0
1.0
6
Clay mining on the mud banks
1.0
2.0
2.0
7
Cattle grazing, trampling effect and seed eating
habit by live stocks
2.5
1.5
3.0
8
Storm dispersal of seeds to the inland areas
4.5
3.0
4.0
Total scores
20.0
15.5
18.0
Table 11.3 Total scores resulted from the estimation of weighted values against the identified
factors of selected islands in the buffer areas of Southwest Sundarban
Total scores
Factors
Patibania Island
Fredrick Island
Henry’s Island
Human uses
5.5
14.5
12.5
Fishery development
3.8
7.6
14.2
Hyper salinity
25.3
19.2
22
Sediment deposition
14.3
13.2
9.4
Storm effects
21.3
18
22.6
Land erosion
8
13.4
14.3
Mangrove regeneration problems
20
15.5
18
11 Mangrove Degradation in the Sundarbans
Table 11.4 The data base on vegetation density and vegetation health generated from the analysis
of Remote Sensing images (1989 and 2015)
Vegetation density
Vegetation health
Category
Area (m
2 ) in 1989 Area (m
2 ) in 2015 Area (m
2
) in 1989 Area (m
2
) in 2015
Very low
50,230
31,208
3944
7702
Low
85,561
86,190
14,309
22,232
Moderate
102,721
105,166
34,950
46,793
High
108,554
106,901
77,392
79,385
Very high
110,336
107,964
106,895
101,229
Table 11.2 (continued)
6
Reduction of land margin swamps by erosion
0.8
0.8
2.0
7
Current concentration and increased wave
heights during landfall of cyclones
1.5
0.5
2.5
8
Slumping and collapsing banks
0.2
0.1
0.3
Total scores
8.0
13.4
14.3
Sl. No. Regeneration problems: (parameters)
1
Unfavorable substrate
4.0
3.0
1.0
2
Change in island elevation and drainage loss
4.0
3.0
3.0
3
Trapping the seeds by fishing nets
1.0
1.0
2.0
4
Crab potting in the mud banks
2.0
1.0
2.0
5
Insect attacks in the mangrove trees
1.0
1.0
1.0
6
Clay mining on the mud banks
1.0
2.0
2.0
7
Cattle grazing, trampling effect and seed eating
habit by live stocks
2.5
1.5
3.0
8
Storm dispersal of seeds to the inland areas
4.5
3.0
4.0
Total scores
20.0
15.5
18.0
Table 11.3 Total scores resulted from the estimation of weighted values against the identified
factors of selected islands in the buffer areas of Southwest Sundarban
Total scores
Factors
Patibania Island
Fredrick Island
Henry’s Island
Human uses
5.5
14.5
12.5
Fishery development
3.8
7.6
14.2
Hyper salinity
25.3
19.2
22
Sediment deposition
14.3
13.2
9.4
Storm effects
21.3
18
22.6
Land erosion
8
13.4
14.3
Mangrove regeneration problems
20
15.5
18
11 Mangrove Degradation in the Sundarbans