

Mangrove
regeneration
problems
Land erosion
Storm effects
Sediment
deposition
Hyper salinity
Fishery
development
Human uses
Patibania island
Fredrick island
Henry’s island
30
25
20
15
5
10
0
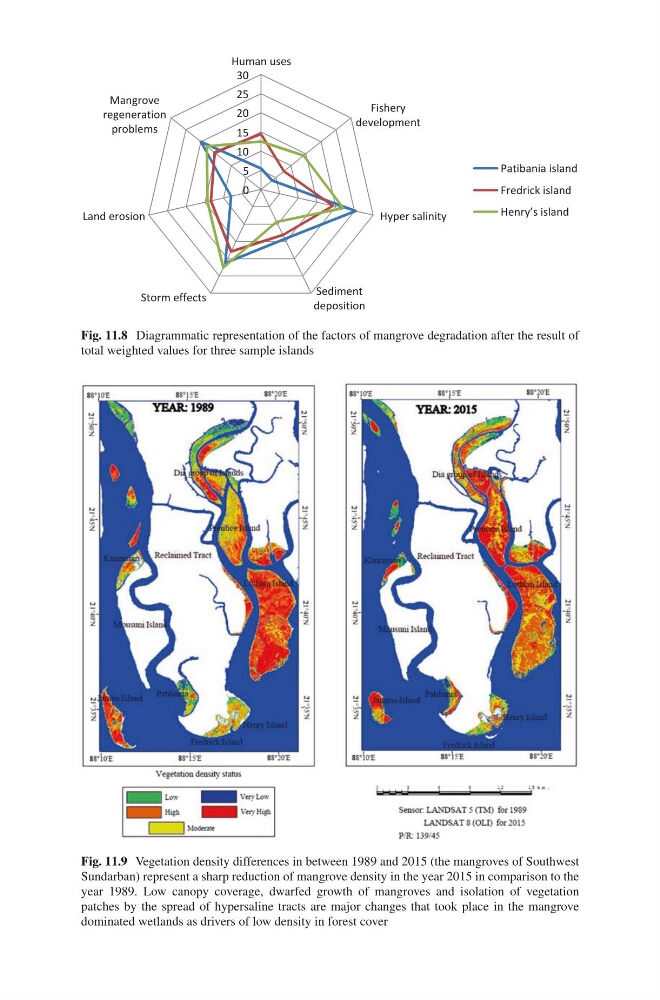
Fig. 11.8 Diagrammatic representation of the factors of mangrove degradation after the result of
total weighted values for three sample islands
Fig. 11.9 Vegetation density differences in between 1989 and 2015 (the mangroves of Southwest
Sundarban) represent a sharp reduction of mangrove density in the year 2015 in comparison to the
year 1989. Low canopy coverage, dwarfed growth of mangroves and isolation of vegetation
patches by the spread of hypersaline tracts are major changes that took place in the mangrove
dominated wetlands as drivers of low density in forest cover
regeneration
problems
Land erosion
Storm effects
Sediment
deposition
Hyper salinity
Fishery
development
Human uses
Patibania island
Fredrick island
Henry’s island
30
25
20
15
5
10
0
Fig. 11.8 Diagrammatic representation of the factors of mangrove degradation after the result of
total weighted values for three sample islands
Fig. 11.9 Vegetation density differences in between 1989 and 2015 (the mangroves of Southwest
Sundarban) represent a sharp reduction of mangrove density in the year 2015 in comparison to the
year 1989. Low canopy coverage, dwarfed growth of mangroves and isolation of vegetation
patches by the spread of hypersaline tracts are major changes that took place in the mangrove
dominated wetlands as drivers of low density in forest cover