

363
Following aforesaid discussion, in this present study, the methodology has been
developed to extract the hypersaline tract within the forest floor. Here a PCA
(Principal Component Analysis) approach has been carried out between salinity
status (Eq. 11.3) and bareness status (Eq. 11.2) of the area and has been used for
thresholding to extract the signature of hypersaline tract.
Here like Bareness Index, a supervised enhancement technique has been carried
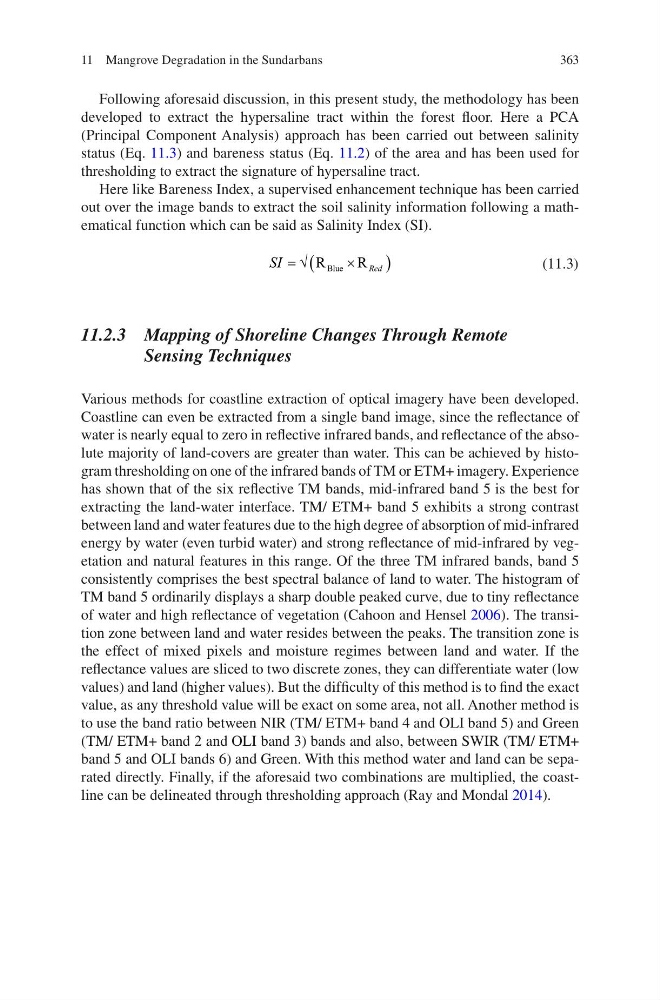
out over the image bands to extract the soil salinity information following a mathematical function which can be said as Salinity Index (SI).
SI
Red
= Ö
´
(
)
R
R
Blue
(11.3)
11.2.3 Mapping of Shoreline Changes Through Remote
Sensing Techniques
Various methods for coastline extraction of optical imagery have been developed.
Coastline can even be extracted from a single band image, since the reflectance of
water is nearly equal to zero in reflective infrared bands, and reflectance of the absolute majority of land-covers are greater than water. This can be achieved by histogram thresholding on one of the infrared bands of TM or ETM+ imagery. Experience
has shown that of the six reflective TM bands, mid-infrared band 5 is the best for
extracting the land-water interface. TM/ ETM+ band 5 exhibits a strong contrast
between land and water features due to the high degree of absorption of mid- infrared
energy by water (even turbid water) and strong reflectance of mid-infrared by vegetation and natural features in this range. Of the three TM infrared bands, band 5
consistently comprises the best spectral balance of land to water. The histogram of
TM band 5 ordinarily displays a sharp double peaked curve, due to tiny reflectance
of water and high reflectance of vegetation (Cahoon and Hensel 2006). The transition zone between land and water resides between the peaks. The transition zone is
the effect of mixed pixels and moisture regimes between land and water. If the
reflectance values are sliced to two discrete zones, they can differentiate water (low
values) and land (higher values). But the difficulty of this method is to find the exact
value, as any threshold value will be exact on some area, not all. Another method is
to use the band ratio between NIR (TM/ ETM+ band 4 and OLI band 5) and Green
(TM/ ETM+ band 2 and OLI band 3) bands and also, between SWIR (TM/ ETM+
band 5 and OLI bands 6) and Green. With this method water and land can be separated directly. Finally, if the aforesaid two combinations are multiplied, the coastline can be delineated through thresholding approach (Ray and Mondal 2014).
11 Mangrove Degradation in the Sundarbans
Following aforesaid discussion, in this present study, the methodology has been
developed to extract the hypersaline tract within the forest floor. Here a PCA
(Principal Component Analysis) approach has been carried out between salinity
status (Eq. 11.3) and bareness status (Eq. 11.2) of the area and has been used for
thresholding to extract the signature of hypersaline tract.
Here like Bareness Index, a supervised enhancement technique has been carried
out over the image bands to extract the soil salinity information following a mathematical function which can be said as Salinity Index (SI).
SI
Red
= Ö
´
(
)
R
R
Blue
(11.3)
11.2.3 Mapping of Shoreline Changes Through Remote
Sensing Techniques
Various methods for coastline extraction of optical imagery have been developed.
Coastline can even be extracted from a single band image, since the reflectance of
water is nearly equal to zero in reflective infrared bands, and reflectance of the absolute majority of land-covers are greater than water. This can be achieved by histogram thresholding on one of the infrared bands of TM or ETM+ imagery. Experience
has shown that of the six reflective TM bands, mid-infrared band 5 is the best for
extracting the land-water interface. TM/ ETM+ band 5 exhibits a strong contrast
between land and water features due to the high degree of absorption of mid- infrared
energy by water (even turbid water) and strong reflectance of mid-infrared by vegetation and natural features in this range. Of the three TM infrared bands, band 5
consistently comprises the best spectral balance of land to water. The histogram of
TM band 5 ordinarily displays a sharp double peaked curve, due to tiny reflectance
of water and high reflectance of vegetation (Cahoon and Hensel 2006). The transition zone between land and water resides between the peaks. The transition zone is
the effect of mixed pixels and moisture regimes between land and water. If the
reflectance values are sliced to two discrete zones, they can differentiate water (low
values) and land (higher values). But the difficulty of this method is to find the exact
value, as any threshold value will be exact on some area, not all. Another method is
to use the band ratio between NIR (TM/ ETM+ band 4 and OLI band 5) and Green
(TM/ ETM+ band 2 and OLI band 3) bands and also, between SWIR (TM/ ETM+
band 5 and OLI bands 6) and Green. With this method water and land can be separated directly. Finally, if the aforesaid two combinations are multiplied, the coastline can be delineated through thresholding approach (Ray and Mondal 2014).
11 Mangrove Degradation in the Sundarbans