

361
dense mangrove forests. Various maps and images, available secondary data from
different sources, database generation and data analysis supported the present work
in identifying the multiple causes of mangrove degradations of the coast. Finally,
the 40 years of professional experience of the present workers in the field of coastal
research, particularly on the critical issues of Sundarban coastal tracts helped to
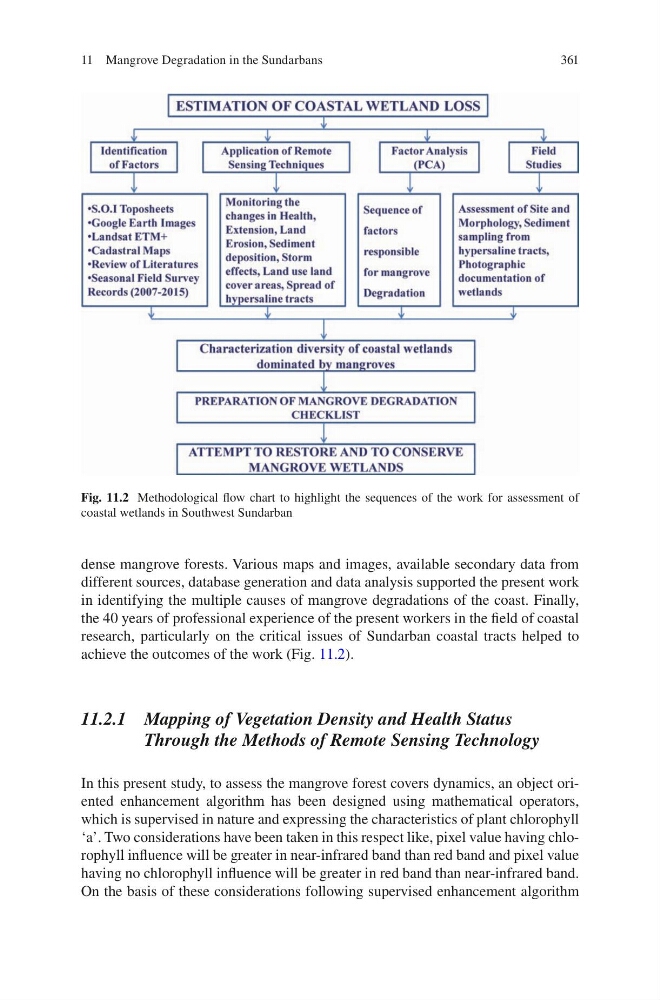
achieve the outcomes of the work (Fig. 11.2).
11.2.1 Mapping of Vegetation Density and Health Status
Through the Methods of Remote Sensing Technology
In this present study, to assess the mangrove forest covers dynamics, an object oriented enhancement algorithm has been designed using mathematical operators,
which is supervised in nature and expressing the characteristics of plant chlorophyll
‘a’. Two considerations have been taken in this respect like, pixel value having chlorophyll influence will be greater in near-infrared band than red band and pixel value
having no chlorophyll influence will be greater in red band than near-infrared band.
On the basis of these considerations following supervised enhancement algorithm
Fig. 11.2 Methodological flow chart to highlight the sequences of the work for assessment of
coastal wetlands in Southwest Sundarban
11 Mangrove Degradation in the Sundarbans
dense mangrove forests. Various maps and images, available secondary data from
different sources, database generation and data analysis supported the present work
in identifying the multiple causes of mangrove degradations of the coast. Finally,
the 40 years of professional experience of the present workers in the field of coastal
research, particularly on the critical issues of Sundarban coastal tracts helped to
achieve the outcomes of the work (Fig. 11.2).
11.2.1 Mapping of Vegetation Density and Health Status
Through the Methods of Remote Sensing Technology
In this present study, to assess the mangrove forest covers dynamics, an object oriented enhancement algorithm has been designed using mathematical operators,
which is supervised in nature and expressing the characteristics of plant chlorophyll
‘a’. Two considerations have been taken in this respect like, pixel value having chlorophyll influence will be greater in near-infrared band than red band and pixel value
having no chlorophyll influence will be greater in red band than near-infrared band.
On the basis of these considerations following supervised enhancement algorithm
Fig. 11.2 Methodological flow chart to highlight the sequences of the work for assessment of
coastal wetlands in Southwest Sundarban
11 Mangrove Degradation in the Sundarbans