

334
stable equilibrium flow velocities to be determined from the O’Brien (1969) and
Jarrett (1976) prism-area relationships.
The Escoffier Diagram (Fig. 10.16) indicated that the estuary channel was in an
unstable scouring mode. In accordance with O’Brien (1931), an equilibrium condition would be reached when the flow area reached some 6,000 m
2
, a tenfold increase.
By that stage the bay-to-ocean spring tidal range ratio (a B /a O ) would have reached
1.0, increasing from 0.14. At an average rate of increase for a B /a O of around 0.0016/a
(Fig. 10.14), it would take some 540 years for the equilibrium cross-sectional area
to be reached. However, taking the approach of Mota Oliviera (1970), where stability could be reached when K reached a value between 0.6 and 0.8, a B /a O would have
a value of between 0.65 and 0.78 and it would take some 300 to 400 years for the
equilibrium cross-sectional area to be reached. It is noted that as scour progresses,
the Escoffier diagram indicates that the rate of change may increase, which would
reduce the time estimated to reach equilibrium.
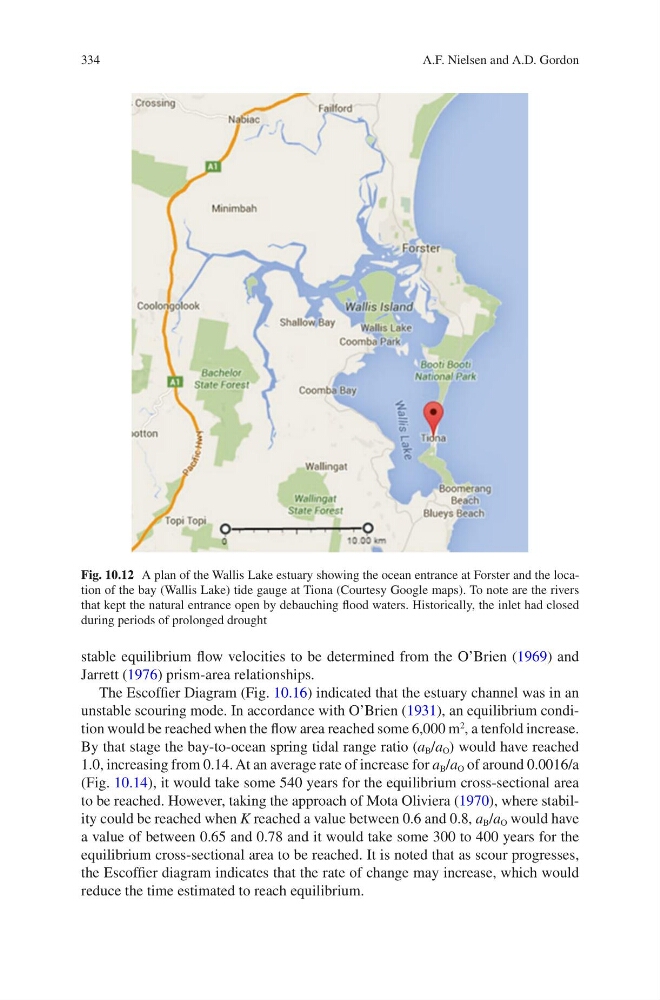
Fig. 10.12 A plan of the Wallis Lake estuary showing the ocean entrance at Forster and the location of the bay (Wallis Lake) tide gauge at Tiona (Courtesy Google maps). To note are the rivers
that kept the natural entrance open by debauching flood waters. Historically, the inlet had closed
during periods of prolonged drought
A.F. Nielsen and A.D. Gordon
stable equilibrium flow velocities to be determined from the O’Brien (1969) and
Jarrett (1976) prism-area relationships.
The Escoffier Diagram (Fig. 10.16) indicated that the estuary channel was in an
unstable scouring mode. In accordance with O’Brien (1931), an equilibrium condition would be reached when the flow area reached some 6,000 m
2
, a tenfold increase.
By that stage the bay-to-ocean spring tidal range ratio (a B /a O ) would have reached
1.0, increasing from 0.14. At an average rate of increase for a B /a O of around 0.0016/a
(Fig. 10.14), it would take some 540 years for the equilibrium cross-sectional area
to be reached. However, taking the approach of Mota Oliviera (1970), where stability could be reached when K reached a value between 0.6 and 0.8, a B /a O would have
a value of between 0.65 and 0.78 and it would take some 300 to 400 years for the
equilibrium cross-sectional area to be reached. It is noted that as scour progresses,
the Escoffier diagram indicates that the rate of change may increase, which would
reduce the time estimated to reach equilibrium.
Fig. 10.12 A plan of the Wallis Lake estuary showing the ocean entrance at Forster and the location of the bay (Wallis Lake) tide gauge at Tiona (Courtesy Google maps). To note are the rivers
that kept the natural entrance open by debauching flood waters. Historically, the inlet had closed
during periods of prolonged drought
A.F. Nielsen and A.D. Gordon