

312
tion, it is requires the establishment of transversal sections spaced uniformly in the
sector where will be evaluated the coastal erosion.
After an attributes revision between the generated lines, satellite imagery and
polylines, it is develop the model to statistically determine the change rate of the
coastline and consequently the erosion potential.
This model calculates the potential erosion using different methods: (a) a linear
regression; (b) weighted least squares regression; (c) the change rate on an endpoint; and (d) jack-knife iterative regression techniques
For this study, it was used the No. 1 method because there were a complete data
series, representative statistical of the historical variability of the coastline.
As it shown in Fig. 9.30, the most intense changes that have taken this coastal
lagoon are in the vicinity of Bocas de Ceniza groin. It can appreciate that historically this location has presented an erosion rate per year of 0.14 m which extends
along the entire bar that protects the Mallorquín Lagoon. In the place where finishes
the subsystem or sub cell in the discharge of León stream, the rate decreases to 0.11
m/year (Fig. 9.30). The erosion continues to decline until it reaches the border of the
cell in the area known as Punta Roca, where have cliffs and an abrasion platform of
more than 8 m of height.
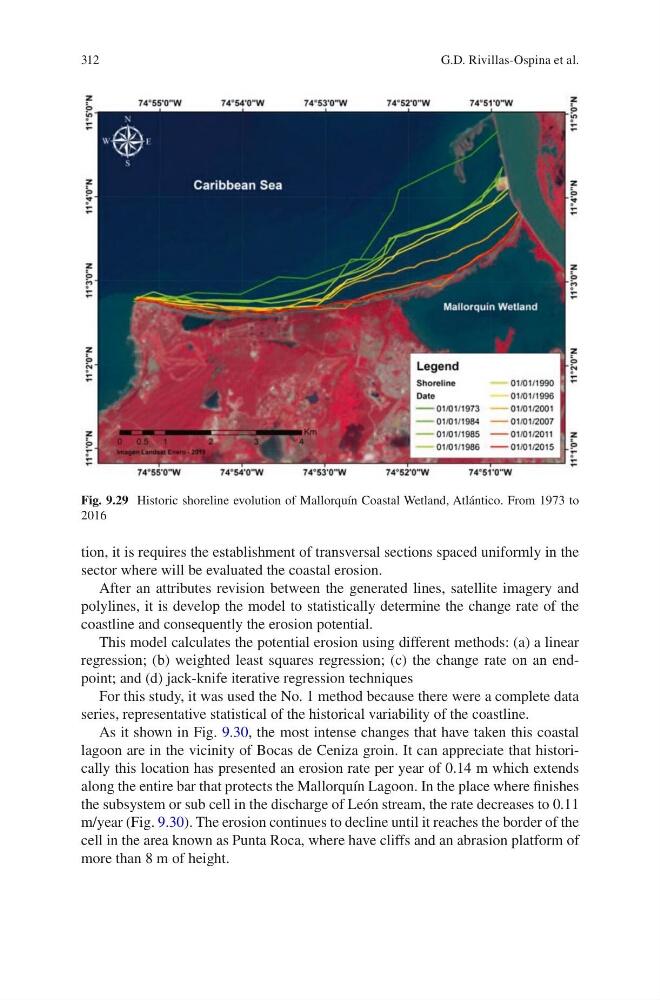
Fig. 9.29 Historic shoreline evolution of Mallorquín Coastal Wetland, Atlántico. From 1973 to
2016
G.D. Rivillas-Ospina et al.
tion, it is requires the establishment of transversal sections spaced uniformly in the
sector where will be evaluated the coastal erosion.
After an attributes revision between the generated lines, satellite imagery and
polylines, it is develop the model to statistically determine the change rate of the
coastline and consequently the erosion potential.
This model calculates the potential erosion using different methods: (a) a linear
regression; (b) weighted least squares regression; (c) the change rate on an endpoint; and (d) jack-knife iterative regression techniques
For this study, it was used the No. 1 method because there were a complete data
series, representative statistical of the historical variability of the coastline.
As it shown in Fig. 9.30, the most intense changes that have taken this coastal
lagoon are in the vicinity of Bocas de Ceniza groin. It can appreciate that historically this location has presented an erosion rate per year of 0.14 m which extends
along the entire bar that protects the Mallorquín Lagoon. In the place where finishes
the subsystem or sub cell in the discharge of León stream, the rate decreases to 0.11
m/year (Fig. 9.30). The erosion continues to decline until it reaches the border of the
cell in the area known as Punta Roca, where have cliffs and an abrasion platform of
more than 8 m of height.
Fig. 9.29 Historic shoreline evolution of Mallorquín Coastal Wetland, Atlántico. From 1973 to
2016
G.D. Rivillas-Ospina et al.