

262
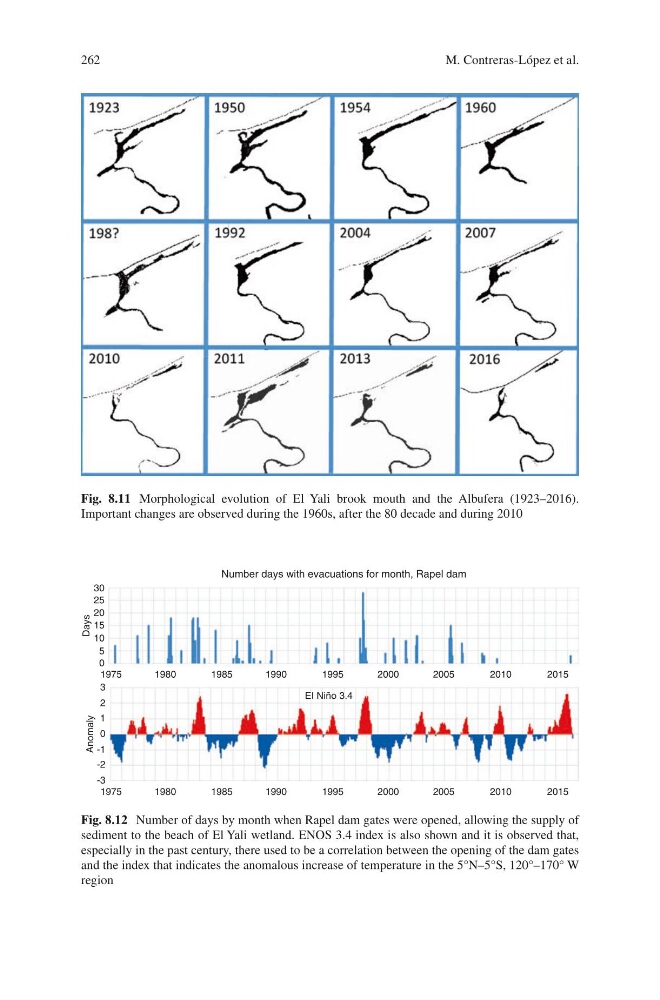
Fig. 8.11 Morphological evolution of El Yali brook mouth and the Albufera (1923–2016).
Important changes are observed during the 1960s, after the 80 decade and during 2010
Number days with evacuations for month, Rapel dam
30
25
20
15
10
5
Days
Anomaly
0
3
2
1
-1
-2
-3
0
1975
1980
1985
1990
1995
EI Niño 3.4
2000
2005
2010
2015
1975
1980
1985
1990
1995
2000
2005
2010
2015
Fig. 8.12 Number of days by month when Rapel dam gates were opened, allowing the supply of
sediment to the beach of El Yali wetland. ENOS 3.4 index is also shown and it is observed that,
especially in the past century, there used to be a correlation between the opening of the dam gates
and the index that indicates the anomalous increase of temperature in the 5°N–5°S, 120°–170° W
region
M. Contreras-López et al.
Fig. 8.11 Morphological evolution of El Yali brook mouth and the Albufera (1923–2016).
Important changes are observed during the 1960s, after the 80 decade and during 2010
Number days with evacuations for month, Rapel dam
30
25
20
15
10
5
Days
Anomaly
0
3
2
1
-1
-2
-3
0
1975
1980
1985
1990
1995
EI Niño 3.4
2000
2005
2010
2015
1975
1980
1985
1990
1995
2000
2005
2010
2015
Fig. 8.12 Number of days by month when Rapel dam gates were opened, allowing the supply of
sediment to the beach of El Yali wetland. ENOS 3.4 index is also shown and it is observed that,
especially in the past century, there used to be a correlation between the opening of the dam gates
and the index that indicates the anomalous increase of temperature in the 5°N–5°S, 120°–170° W
region
M. Contreras-López et al.