

36
Joan Josep Ibanez, Maria Jose Lled6, Juan Rafael Sanchez and Ferran Roda
the aboveground arboreal biomass averaged over the whole holm oak forest
of the Torrent de la Mina catchment was 78.8 ± SE 4.8 Mg ha- 1 • This lower
mean biomass compared to Prades is a reflection of the more broken forest
cover in the rugged Montseny catchment, and of the effects of past slashand-burning and of a recent thinning in parts of this catchment. When
closed-canopy plots within the Torrent de la Mina catchment are considered,
the mean tree biomass (103.7 ± SE 8.3 Mg ha- 1 ; Mayor 1990) is similar to that
at Prades. Our previously reported tree biomass for the permanent plot at
Montseny (160 Mg ha- 1 in 1978; Ferres 1984; Escarre et al. 1987) is near the
maximum for the Torrent de la Mina catchment. This can be attributed to the
fact that the permanent plot is situated on a deep soil in a valley bottom and
bears a high quality stand.
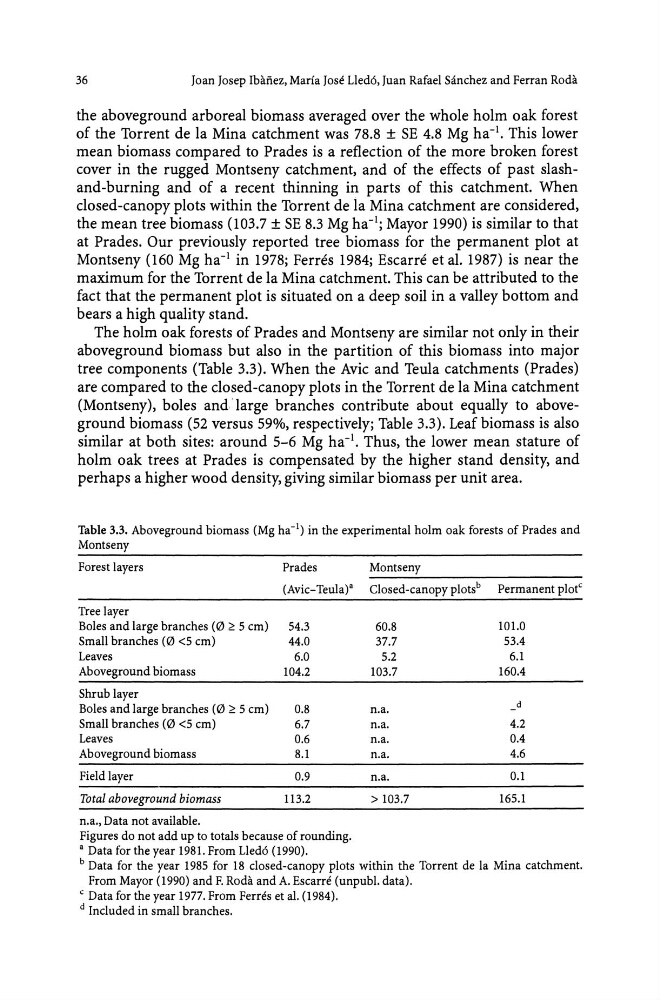
The holm oak forests of Prades and Montseny are similar not only in their
aboveground biomass but also in the partition of this biomass into major
tree components (Table 3.3). When the Avic and Teula catchments (Prades)
are compared to the closed-canopy plots in the Torrent de la Mina catchment
(Montseny), boles and; large branches contribute about equally to aboveground biomass (52 versus 59%, respectively; Table 3.3). Leaf biomass is also
similar at both sites: around 5-6 Mg ha- 1 • Thus, the lower mean stature of
holm oak trees at Prades is compensated by the higher stand density, and
perhaps a higher wood density, giving similar biomass per unit area.
Table 3.3. Aboveground biomass (Mg ha- 1 ) in the experimental holm oak forests of Prades and
Montseny
Forest layers
Prades
Montseny
(Avic-Teula)8 Closed-canopy plots b Permanent plot C
Tree layer
Boles and large branches (0 ~ 5 em)
54.3
60.8
101.0
Small branches (0 <5 em)
44.0
37.7
53.4
Leaves
6.0
5.2
6.1
Aboveground biomass
104.2
103.7
16D.4
Shrub layer
d
Boles and large branches (0 ~ 5 em)
0.8
n.a.
-
Small branches (0 <5 em)
6.7
n.a.
4.2
Leaves
0.6
n.a.
0.4
Aboveground biomass
8.1
n.a.
4.6
Field layer
0.9
n.a.
0.1
Total aboveground biomass
113.2
> 103.7
165.1
n.a., Data not available.
Figures do not add up to totals because of rounding.
8 Data for the year 1981. From Lled6 (1990).
b Data for the year 1985 for 18 closed-canopy plots within the Torrent de la Mina catchment.
From Mayor (1990) and F. Roda and A. Escarre (unpubl. data).
C Data for the year 1977. From Ferres et al. (1984).
d Included in small branches.
Joan Josep Ibanez, Maria Jose Lled6, Juan Rafael Sanchez and Ferran Roda
the aboveground arboreal biomass averaged over the whole holm oak forest
of the Torrent de la Mina catchment was 78.8 ± SE 4.8 Mg ha- 1 • This lower
mean biomass compared to Prades is a reflection of the more broken forest
cover in the rugged Montseny catchment, and of the effects of past slashand-burning and of a recent thinning in parts of this catchment. When
closed-canopy plots within the Torrent de la Mina catchment are considered,
the mean tree biomass (103.7 ± SE 8.3 Mg ha- 1 ; Mayor 1990) is similar to that
at Prades. Our previously reported tree biomass for the permanent plot at
Montseny (160 Mg ha- 1 in 1978; Ferres 1984; Escarre et al. 1987) is near the
maximum for the Torrent de la Mina catchment. This can be attributed to the
fact that the permanent plot is situated on a deep soil in a valley bottom and
bears a high quality stand.
The holm oak forests of Prades and Montseny are similar not only in their
aboveground biomass but also in the partition of this biomass into major
tree components (Table 3.3). When the Avic and Teula catchments (Prades)
are compared to the closed-canopy plots in the Torrent de la Mina catchment
(Montseny), boles and; large branches contribute about equally to aboveground biomass (52 versus 59%, respectively; Table 3.3). Leaf biomass is also
similar at both sites: around 5-6 Mg ha- 1 • Thus, the lower mean stature of
holm oak trees at Prades is compensated by the higher stand density, and
perhaps a higher wood density, giving similar biomass per unit area.
Table 3.3. Aboveground biomass (Mg ha- 1 ) in the experimental holm oak forests of Prades and
Montseny
Forest layers
Prades
Montseny
(Avic-Teula)8 Closed-canopy plots b Permanent plot C
Tree layer
Boles and large branches (0 ~ 5 em)
54.3
60.8
101.0
Small branches (0 <5 em)
44.0
37.7
53.4
Leaves
6.0
5.2
6.1
Aboveground biomass
104.2
103.7
16D.4
Shrub layer
d
Boles and large branches (0 ~ 5 em)
0.8
n.a.
-
Small branches (0 <5 em)
6.7
n.a.
4.2
Leaves
0.6
n.a.
0.4
Aboveground biomass
8.1
n.a.
4.6
Field layer
0.9
n.a.
0.1
Total aboveground biomass
113.2
> 103.7
165.1
n.a., Data not available.
Figures do not add up to totals because of rounding.
8 Data for the year 1981. From Lled6 (1990).
b Data for the year 1985 for 18 closed-canopy plots within the Torrent de la Mina catchment.
From Mayor (1990) and F. Roda and A. Escarre (unpubl. data).
C Data for the year 1977. From Ferres et al. (1984).
d Included in small branches.