

Functional Responses to Thinning
331
23.4 Leaf Population Dynamics After Thinning
Leaves and fine roots are the most active parts of trees. As a consequence, it
can be expected that the changes induced by thinning that can affect the
physiology of the tree will be quickly reflected in the structure and dynamics
of the leaves (Castell et al. 1994). Evergreen trees such as holm oak have different cohorts of leaves with different morphological and physiological traits
(Chap. 9). This heterogeneity arises because these leaf cohorts are produced
in different years under different environmental conditions, and also because
the position of a leaf within the canopy determines its structural and
physiological characteristics (Harper 1989). The analysis of leaf population
dynamics is of the utmost importance to understand the recover capacity of
holm oak after disturbances.
On a representative sample of branches from trees selected at random
(Gracia et al. 1996) leaf population dynamics was analyzed following the
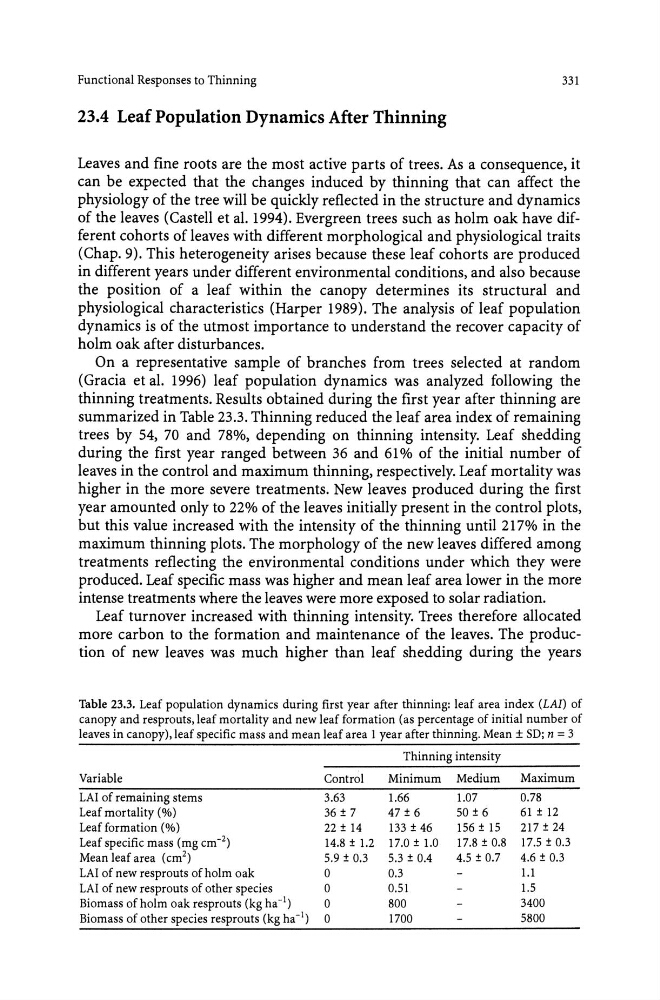
thinning treatments. Results obtained during the first year after thinning are
summarized in Table 23.3. Thinning reduced the leaf area index of remaining
trees by 54, 70 and 78%, depending on thinning intensity. Leaf shedding
during the first year ranged between 36 and 61 % of the initial number of
leaves in the control and maximum thinning, respectively. Leaf mortality was
higher in the more severe treatments. New leaves produced during the first
year amounted only to 22% of the leaves initially present in the control plots,
but this value increased with the intensity of the thinning until 217% in the
maximum thinning plots. The morphology of the new leaves differed among
treatments reflecting the environmental conditions under which they were
produced. Leaf specific mass was higher and mean leaf area lower in the more
intense treatments where the leaves were more exposed to solar radiation.
Leaf turnover increased with thinning intensity. Trees therefore allocated
more carbon to the formation and maintenance of the leaves. The production of new leaves was much higher than leaf shedding during the years
Table 23.3. Leaf population dynamics during first year after thinning: leaf area index (LAI) of
canopy and resprouts, leaf mortality and new leaf formation (as percentage of initial number of
leaves in canopy), leaf specific mass and mean leaf area 1 year after thinning. Mean ± SD; n = 3
Thinning intensity
Variable
Control
Minimum Medium
Maximum
LAI of remaining stems
3.63
1.66
1.07
0.78
Leaf mortality (%)
36 ± 7
47 ± 6
50 ± 6
61 ± 12
Leaf formation (%)
22 ± 14
133 ± 46
156 ± 15
217 ± 24
Leaf specific mass (mg cm- 2 )
14.8 ± 1.2 17.0 ± 1.0 17.8 ± 0.8 17.5 ± 0.3
Mean leaf area (cm 2 )
5.9 ± 0.3
5.3 ± 0.4
4.5 ± 0.7
4.6 ± 0.3
LAI of new resprouts of holm oak
0
0.3
1.1
LAI of new resprouts of other species
0
0.51
1.5
Biomass of holm oak resprouts (kg ha- I )
0
800
3400
Biomass of other species resprouts (kg ha -I) 0
1700
5800
331
23.4 Leaf Population Dynamics After Thinning
Leaves and fine roots are the most active parts of trees. As a consequence, it
can be expected that the changes induced by thinning that can affect the
physiology of the tree will be quickly reflected in the structure and dynamics
of the leaves (Castell et al. 1994). Evergreen trees such as holm oak have different cohorts of leaves with different morphological and physiological traits
(Chap. 9). This heterogeneity arises because these leaf cohorts are produced
in different years under different environmental conditions, and also because
the position of a leaf within the canopy determines its structural and
physiological characteristics (Harper 1989). The analysis of leaf population
dynamics is of the utmost importance to understand the recover capacity of
holm oak after disturbances.
On a representative sample of branches from trees selected at random
(Gracia et al. 1996) leaf population dynamics was analyzed following the
thinning treatments. Results obtained during the first year after thinning are
summarized in Table 23.3. Thinning reduced the leaf area index of remaining
trees by 54, 70 and 78%, depending on thinning intensity. Leaf shedding
during the first year ranged between 36 and 61 % of the initial number of
leaves in the control and maximum thinning, respectively. Leaf mortality was
higher in the more severe treatments. New leaves produced during the first
year amounted only to 22% of the leaves initially present in the control plots,
but this value increased with the intensity of the thinning until 217% in the
maximum thinning plots. The morphology of the new leaves differed among
treatments reflecting the environmental conditions under which they were
produced. Leaf specific mass was higher and mean leaf area lower in the more
intense treatments where the leaves were more exposed to solar radiation.
Leaf turnover increased with thinning intensity. Trees therefore allocated
more carbon to the formation and maintenance of the leaves. The production of new leaves was much higher than leaf shedding during the years
Table 23.3. Leaf population dynamics during first year after thinning: leaf area index (LAI) of
canopy and resprouts, leaf mortality and new leaf formation (as percentage of initial number of
leaves in canopy), leaf specific mass and mean leaf area 1 year after thinning. Mean ± SD; n = 3
Thinning intensity
Variable
Control
Minimum Medium
Maximum
LAI of remaining stems
3.63
1.66
1.07
0.78
Leaf mortality (%)
36 ± 7
47 ± 6
50 ± 6
61 ± 12
Leaf formation (%)
22 ± 14
133 ± 46
156 ± 15
217 ± 24
Leaf specific mass (mg cm- 2 )
14.8 ± 1.2 17.0 ± 1.0 17.8 ± 0.8 17.5 ± 0.3
Mean leaf area (cm 2 )
5.9 ± 0.3
5.3 ± 0.4
4.5 ± 0.7
4.6 ± 0.3
LAI of new resprouts of holm oak
0
0.3
1.1
LAI of new resprouts of other species
0
0.51
1.5
Biomass of holm oak resprouts (kg ha- I )
0
800
3400
Biomass of other species resprouts (kg ha -I) 0
1700
5800