

330
Carlos A. Gracia, Santiago Sabate, Juan Manuel Martinez and Eva Albeza
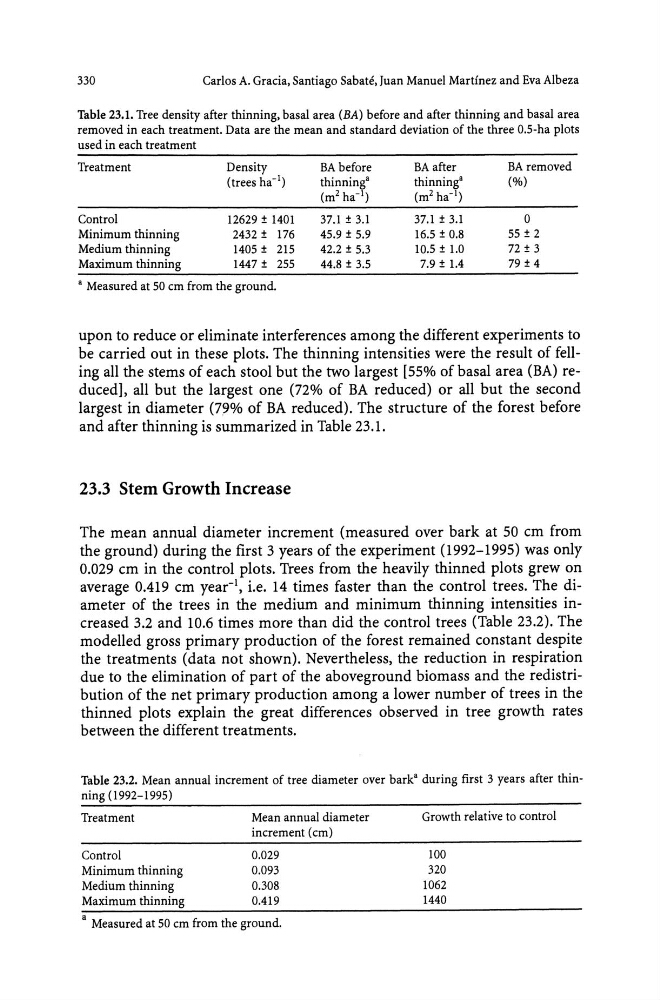
Table 23.1. Tree density after thinning, basal area (BA) before and after thinning and basal area
removed in each treatment. Data are the mean and standard deviation of the three 0.5-ha plots
used in each treatment
Treatment
Density
BA before
BA after
BA removed
(trees ha- 1 )
thinning'
thinning'
(%)
(m 2 ha- 1 )
(m 2 ha- 1 )
Control
12629 ± 1401
37.1 ± 3.1
37.1 ± 3.1
0
Minimum thinning
2432 ± 176
45.9 ± 5.9
16.5 ± 0.8
55 ± 2
Medium thinning
1405 ± 215
42.2 ± 5.3
10.5 ± 1.0
72 ± 3
Maximum thinning
1447 ± 255
44.8 ± 3.5
7.9 ± 1.4
79 ± 4
, Measured at 50 cm from the ground.
upon to reduce or eliminate interferences among the different experiments to
be carried out in these plots. The thinning intensities were the result of felling all the stems of each stool but the two largest [55% of basal area (BA) reduced], all but the largest one (72% of BA reduced) or all but the second
largest in diameter (79% of BA reduced). The structure of the forest before
and after thinning is summarized in Table 23.1.
23.3 Stem Growth Increase
The mean annual diameter increment (measured over bark at 50 cm from
the ground) during the first 3 years of the experiment (1992-1995) was only
0.029 cm in the control plots. Trees from the heavily thinned plots grew on
average 0.419 cm year-I, i.e. 14 times faster than the control trees. The diameter of the trees in the medium and minimum thinning intensities increased 3.2 and 10.6 times more than did the control trees (Table 23.2). The
modelled gross primary production of the forest remained constant despite
the treatments (data not shown). Nevertheless, the reduction in respiration
due to the elimination of part of the aboveground biomass and the redistribution of the net primary production among a lower number of trees in the
thinned plots explain the great differences observed in tree growth rates
between the different treatments.
Table 23.2. Mean annual increment of tree diameter over bark' during first 3 years after thinning (1992-1995)
Treatment
Mean annual diameter
increment (cm)
Control
0.029
Minimum thinning
0.093
Medium thinning
0.308
Maximum thinning
0.419
a Measured at 50 cm from the ground.
Growth relative to control
100
320
1062
1440
Carlos A. Gracia, Santiago Sabate, Juan Manuel Martinez and Eva Albeza
Table 23.1. Tree density after thinning, basal area (BA) before and after thinning and basal area
removed in each treatment. Data are the mean and standard deviation of the three 0.5-ha plots
used in each treatment
Treatment
Density
BA before
BA after
BA removed
(trees ha- 1 )
thinning'
thinning'
(%)
(m 2 ha- 1 )
(m 2 ha- 1 )
Control
12629 ± 1401
37.1 ± 3.1
37.1 ± 3.1
0
Minimum thinning
2432 ± 176
45.9 ± 5.9
16.5 ± 0.8
55 ± 2
Medium thinning
1405 ± 215
42.2 ± 5.3
10.5 ± 1.0
72 ± 3
Maximum thinning
1447 ± 255
44.8 ± 3.5
7.9 ± 1.4
79 ± 4
, Measured at 50 cm from the ground.
upon to reduce or eliminate interferences among the different experiments to
be carried out in these plots. The thinning intensities were the result of felling all the stems of each stool but the two largest [55% of basal area (BA) reduced], all but the largest one (72% of BA reduced) or all but the second
largest in diameter (79% of BA reduced). The structure of the forest before
and after thinning is summarized in Table 23.1.
23.3 Stem Growth Increase
The mean annual diameter increment (measured over bark at 50 cm from
the ground) during the first 3 years of the experiment (1992-1995) was only
0.029 cm in the control plots. Trees from the heavily thinned plots grew on
average 0.419 cm year-I, i.e. 14 times faster than the control trees. The diameter of the trees in the medium and minimum thinning intensities increased 3.2 and 10.6 times more than did the control trees (Table 23.2). The
modelled gross primary production of the forest remained constant despite
the treatments (data not shown). Nevertheless, the reduction in respiration
due to the elimination of part of the aboveground biomass and the redistribution of the net primary production among a lower number of trees in the
thinned plots explain the great differences observed in tree growth rates
between the different treatments.
Table 23.2. Mean annual increment of tree diameter over bark' during first 3 years after thinning (1992-1995)
Treatment
Mean annual diameter
increment (cm)
Control
0.029
Minimum thinning
0.093
Medium thinning
0.308
Maximum thinning
0.419
a Measured at 50 cm from the ground.
Growth relative to control
100
320
1062
1440