

Soil Fertility After Fire and Clear-Cutting
321
500
400 t
C
300
200
Y
'V
20
N
K
15
'0
'"
10
C>
C>
5
.§.
c:
0
:;:;
~
'E
5
S
Qj
0
c:
4
8
c 3
Q)
E Q)
2
iii
'0
Q)
D
J:.
'"
4:
120
Ca
AI
100
80
60
40
20
0
0 200 400 600 800
0 200 400 600 800
Days after the fire
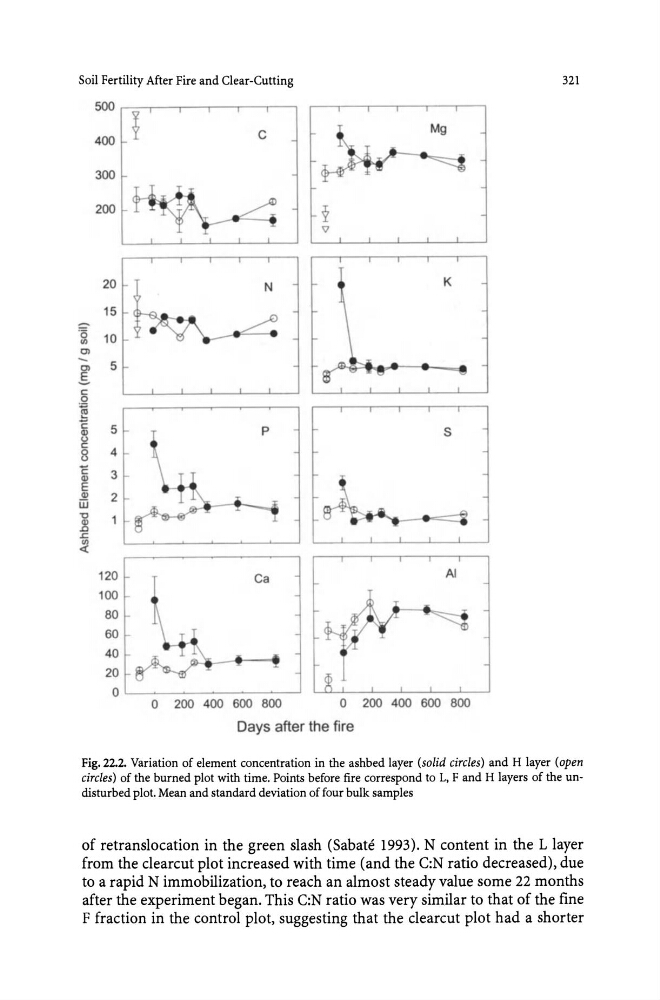
Fig. 22.2. Variation of element concentration in the ashbed layer (solid circles) and H layer (open
circles) of the burned plot with time. Points before fire correspond to L, F and H layers of the undisturbed plot. Mean and standard deviation of four bulk samples
of retranslocation in the green slash (Sabate 1993). N content in the L layer
from the clearcut plot increased with time (and the C:N ratio decreased), due
to a rapid N immobilization, to reach an almost steady value some 22 months
after the experiment began. This C:N ratio was very similar to that of the fine
F fraction in the control plot, suggesting that the clearcut plot had a shorter
321
500
400 t
C
300
200
Y
'V
20
N
K
15
'0
'"
10
C>
C>
5
.§.
c:
0
:;:;
~
'E
5
S
Qj
0
c:
4
8
c 3
Q)
E Q)
2
iii
'0
Q)
D
J:.
'"
4:
120
Ca
AI
100
80
60
40
20
0
0 200 400 600 800
0 200 400 600 800
Days after the fire
Fig. 22.2. Variation of element concentration in the ashbed layer (solid circles) and H layer (open
circles) of the burned plot with time. Points before fire correspond to L, F and H layers of the undisturbed plot. Mean and standard deviation of four bulk samples
of retranslocation in the green slash (Sabate 1993). N content in the L layer
from the clearcut plot increased with time (and the C:N ratio decreased), due
to a rapid N immobilization, to reach an almost steady value some 22 months
after the experiment began. This C:N ratio was very similar to that of the fine
F fraction in the control plot, suggesting that the clearcut plot had a shorter